Thursday, November 16, 2023

Here is another week of work for this month’s 30 Day Map Challenge.

Day 10 - North America


I’ve been looking at a tree identification guide and was inspired by the map in the book. I also thought this would be a nice time to get out the watercolor pencils. The colors didn’t blend as much as hoped-I probably didn’t use enough water or the right kind of paper.


Day 11 - Retro


Going for the 1950’s geography textbook look hopefully with some success.

Day 12 - South America

These animals have overlapping ranges so I highlighted the ones with the smallest ranges. Alpacas (in the wild) live mainly in the high mountains. This map features my first ever llama north arrow.

Day 13 - Choropleth

Choropleth is a somewhat map jargon-y term referring to discreet areas, usually classified in some way. For example, election maps. Usually there would be many areas classified into categories so choosing a state with only three counties and one for each category doesn’t really make this a true choropleth.

Day 14 - Europe

This was an experiment in playing with a space theme and showing some discreet countries that don’t have much in common other than being at the edges of the continent.

Day 15 - OpenStreetMap

I went with my default Openstreetmap mode of finding some random item (gas stations) and picking a random location. This could have been a much better learning opportunity as there are many other ways of working with this huge data set and I really do need to learn more about it. However, life intrudes and I didn’t have the time so I chose a quick subject and location. The logos are from the six most prevalent gas station brands.

It turns out Paraguay has the most per capita gas stations of any country in South America for various reasons (source) so this map is almost unreadable. I also learned that Petropar is the country’s national oil company while Petrobras is a Brazilian company.

Day 16 - Oceania

 Every other continent gets a day this year so why not Oceania? Here are the roads via the Globio Roads database. I’m not sure why the network in New Zealand is so much denser than anywhere else but there it is. I like the way you get a basic population and country shape map by showing roads and nothing else.


Thursday, November 9, 2023

30 Day Map Challenge 2023 Days 3 9

Here’s what I’ve been working on for the past week’s 30 Day Map Challenges with the prompts listed.

Day 3 - Polygons

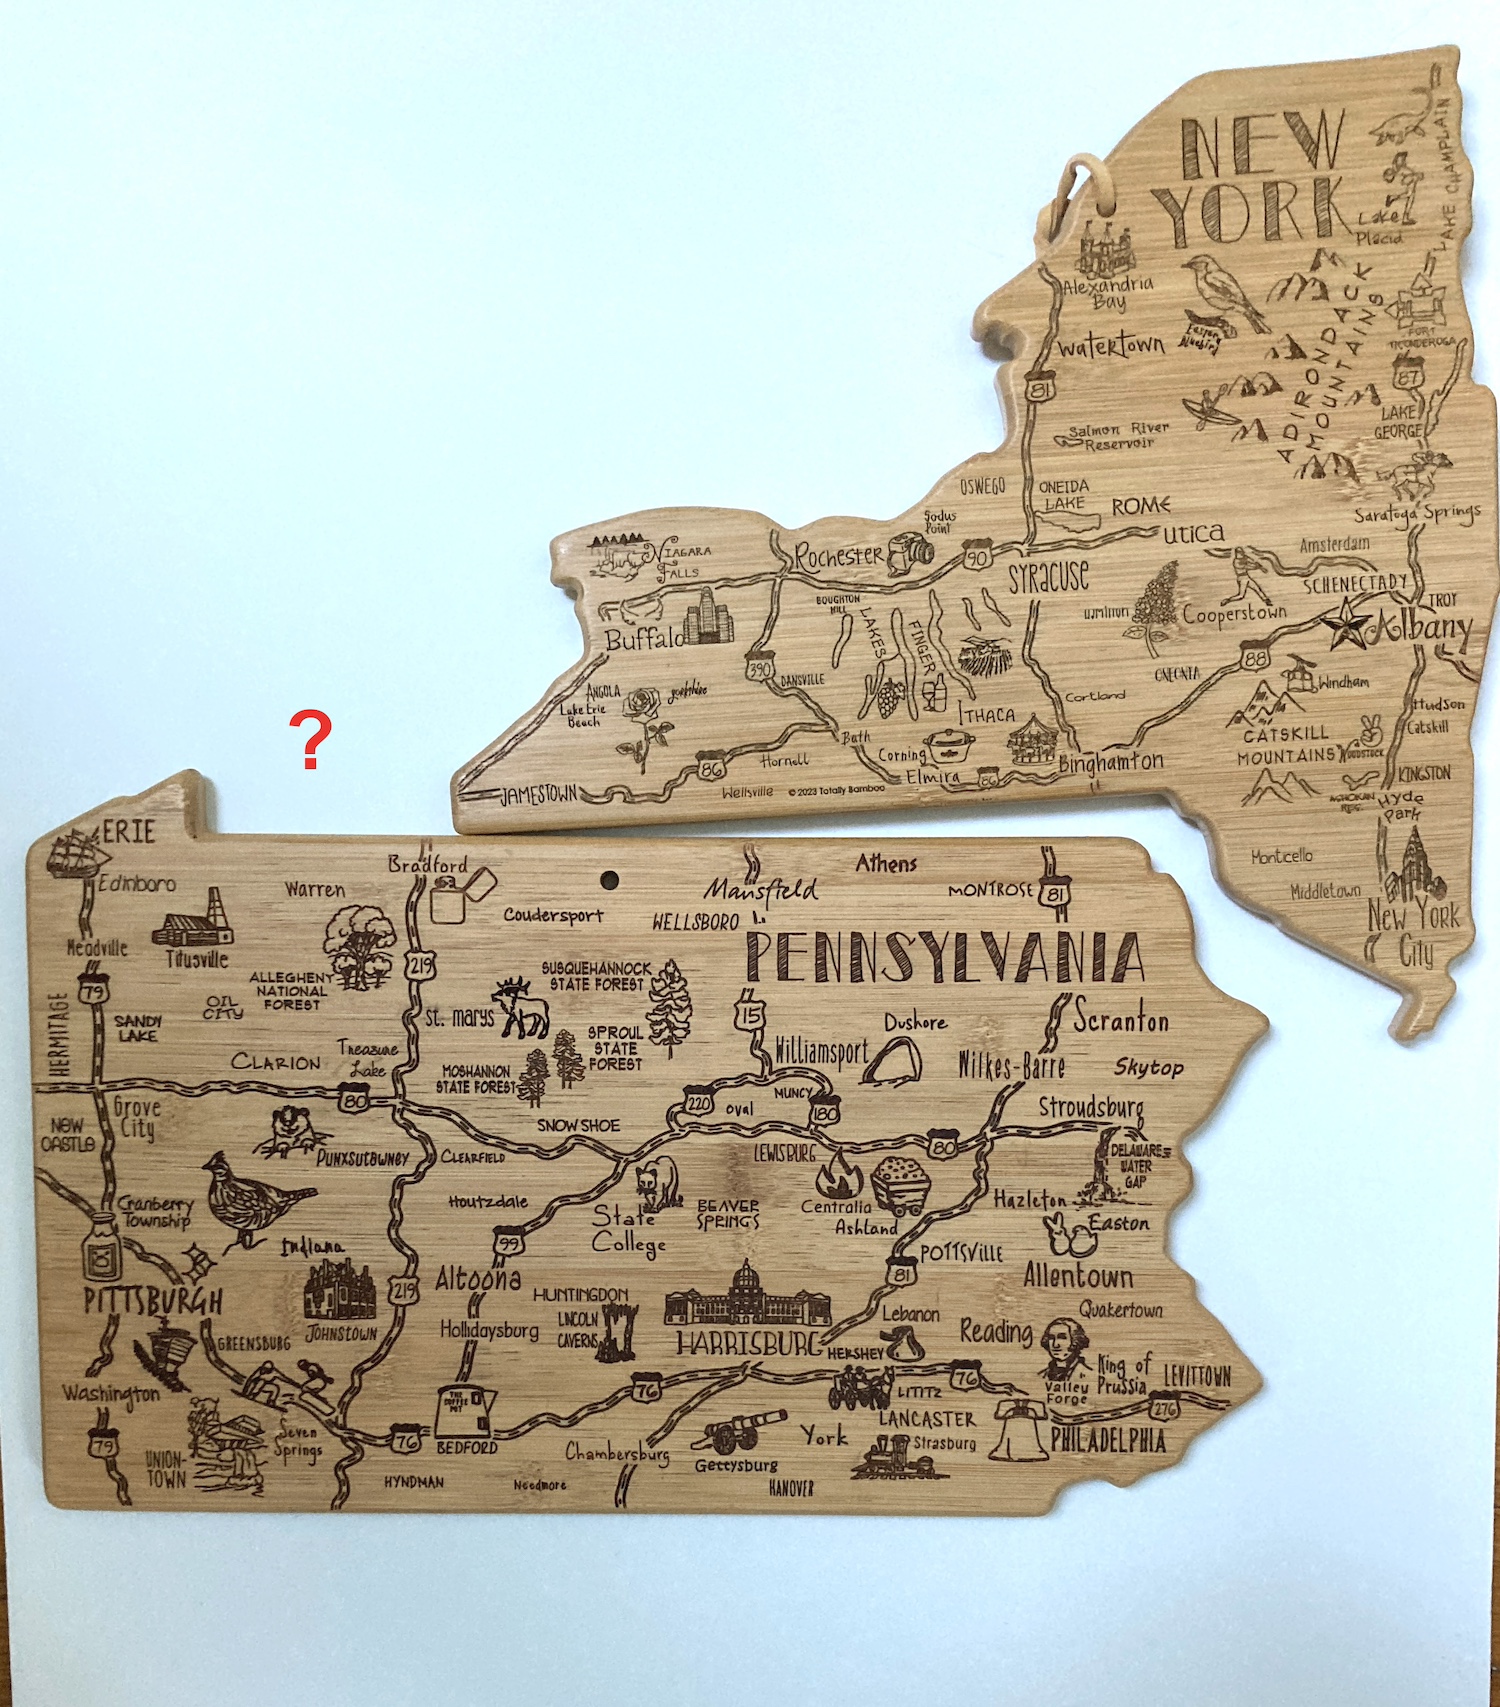
This is not exactly a hand made map, more having fun with cutting boards. My wife gave me the Pennsylvania board a few years ago and I used it in the 2021 challenge as seen here-a map of GDP by metropolitan areas. 

Her brother just gave me the New York version and hey, they don’t fit together. I guess I shouldn’t expect them to be scaled - the Delaware version would only fit a clove of garlic.

Day 4 - A bad map

A map of Lake Okeechobee zoomed way too far in. Could be any lake but Okeechobee is a great name. There could be a lesson here about maps losing their utility when you’re too far zoomed in or maybe it’s just a cheap lazy joke.

Day 5 - Analog (ie map without a computer)


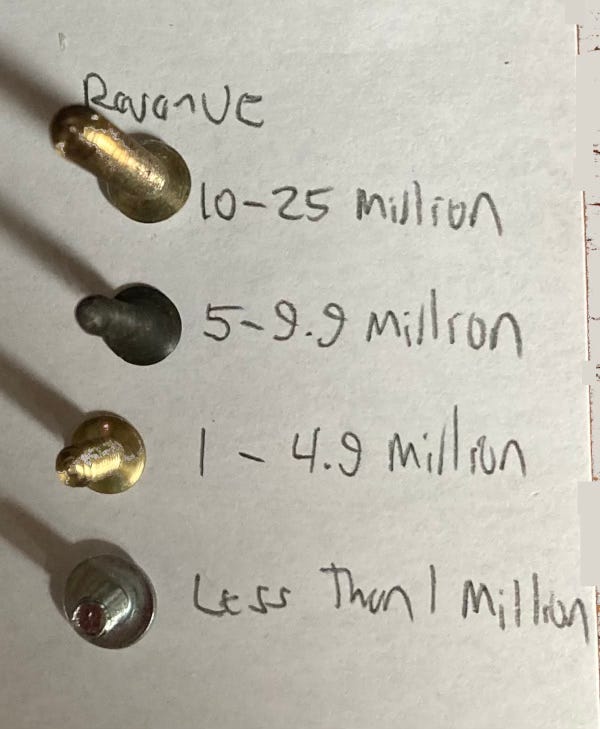
Screw manufacturers. I had an idea in at night when not sleeping about doing a map of nail manufacturers in the USA. The idea came to me because as a college intern in Albany doing local property history I found that there were many nail shops in my neighborhood. It turns out that most nails are imported now. So I did screws instead. The data source (Thomas) is biased towards their featured products but there’s contradictory info online and I needed one stable list. 

Here is the legend from a readable angle.

Day 6 - Asia

Album covers by the band Asia, who of course are from England. I don’t love how they turned progressive rock into pop treacle but their album covers are wonderful. There are more informative topics out there but this one was fun to do.

Day 7 - Navigation

I have a friend who has organized a somewhat yearly pontoon boat ride down the Parker River in Newbury, Massachusetts and into Plum Island (really a peninsula) Sound. This year we got stuck on a sandbar. That was the inspiration for this map.

Day 8 - Africa

Where do African violets come from? From the Eastern Arc Mountains of Tanzania and Kenya. The version I posted on social media had a small error in the southernmost region. This version is more correct.

Day 9 - Hexagons

States of the US as RStudio hex stickers. Hex stickers are a cultural phenomenon among users of R software. They are for different modules (not sure if that’s the best word). I don’t know much about R and but you can make maps with it using the ggplot module (see Wyoming above). If I were a better software user I would have made this map in R but I didn’t have time to figure that out.

I tried to make some logical choices here. Maine is the lobstr module, California has a seal and Kansas has a yellow brick road.

Probably more to come next week as I can’t seem to stop myself….

Thursday, November 2, 2023

Thirty Day Map Challenge 2023-Days 1 and 2


Yes it’s November and time for another 30 Day Map Challenge. As in previous years (see here for last year) I began with no real goal of completing it or much idea beyond the first few days. Also as in previous years I’m getting sucked in again. Only two days of action to report so far: here they are.

Day 1 - Points

Goals per game for each NHL team. Yes technically these are called goals, but for the players they register as points.

The puck sizing thing wasn’t a huge success but you get the idea. San Jose isn’t scoring much while Vancouver is. Teams have played less than 10 games so this is a very small sample size. Statistically and visually there’s not much anyone should take away from this other than me having fun with a pun and a bunch of hockey logos.

Day 2 - Lines

Here are the overlapping claims in the South China Sea (even the name is in dispute) from China, Philippines, Vietnam, Malaysia and Brunei-marked out in yarn.


The yarn idea came about partially from last year’s South America map (Day 17 here) but also because I was having trouble drawing proper curves with my software. I like the idea of using soft lines for claims that many might consider absurd. Are those longitude lines? No, they’re the lines of a bad printer. I was going to photoshop them out but then decided I kind of like them.

Will there be more? Stay tuned. These are being posted daily on my Mastodon and Bluesky pages if you care (you probably need an account to see Bluesky).

Wednesday, October 25, 2023

Harry Beck's Famous Subway Map Goes Airborne

This map was published a month ago in the Londonist. Just about every other map blog has already picked up on it and I am late to the game. However, I've spent so much time looking at it that I think it's worth a visit even if you've already seen it. It was drawn by Harry Beck, author of the iconic London tube map that discarded geography for straight lines. Here he applied it to airline travel.

via Londonist

Specifically it shows all the routes of Imperial Airways and it's subsidiaries. The map was discovered at the Croydon Airport in England and dates from a few years after his subway map was produced. The legend takes a little work to understand. Generally the busier lines have more service but there are various complications within that scheme.

Here is a close up from Europe where things are busiest to illustrate the differing line weights. Interesting how the routes through Germany differ in winter and summer.

I spent a lot of time looking at Africa, trying to translate the colonial country and city names to their current ones. 

You too can spend way too much time exploring the eastern hemisphere's 1930's airports here.


Thursday, October 19, 2023

The Real World Costs of Bitcoin

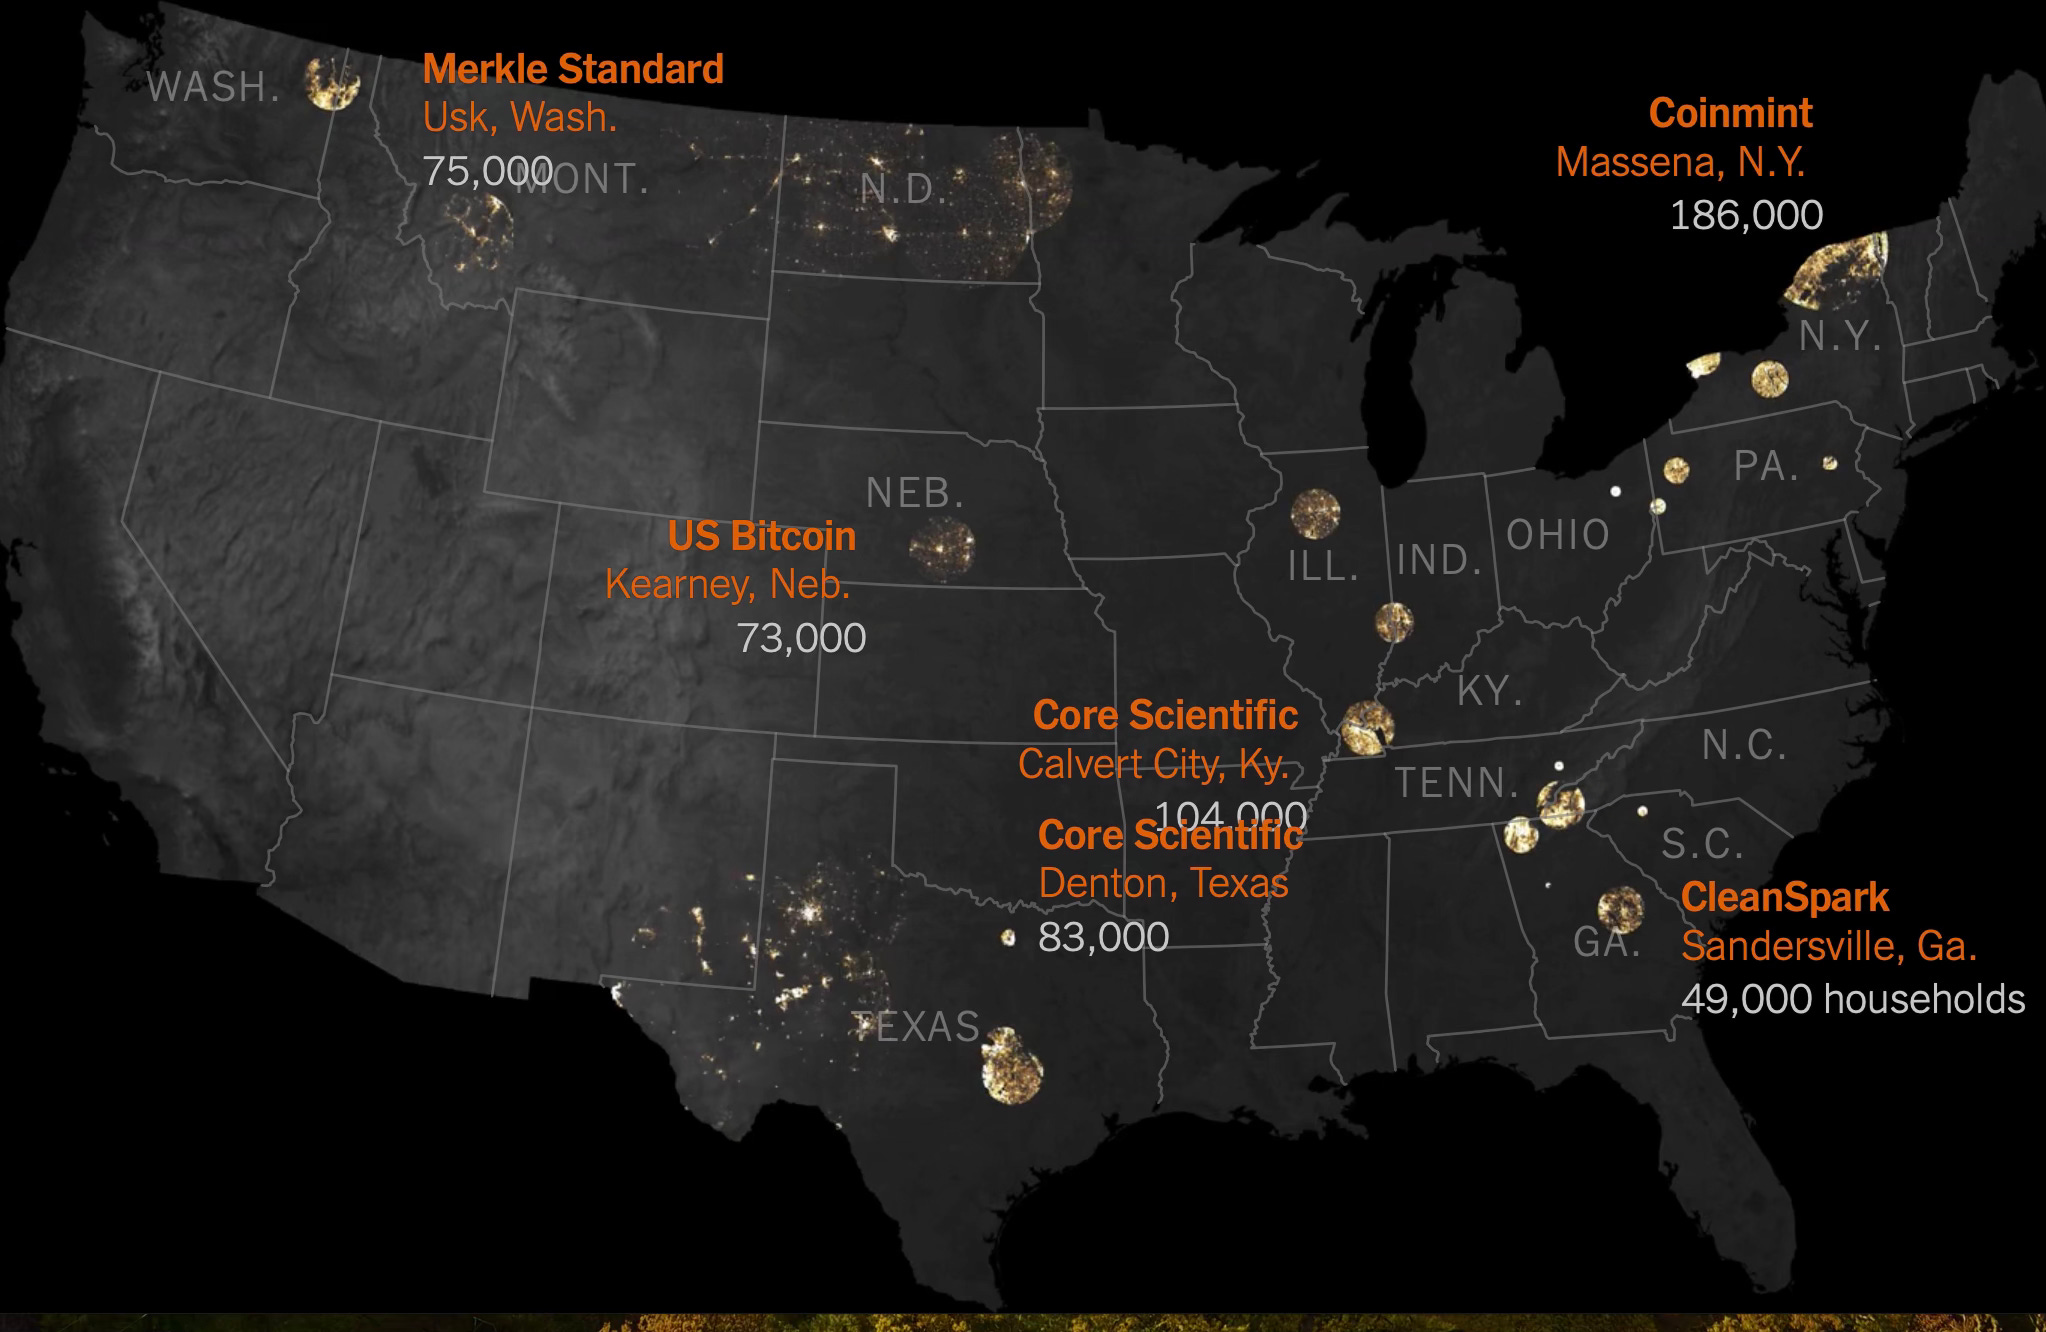
 This is from April but at last week’s NACIS conference I saw Zach Levitt speak about making these graphics for the New York Times. The story details how in the midst of a winter storm that left tens or thousands without power, bitcoin mines in the state kept running, until the companies were finally paid handsomely to shut down operations. One company was paid $18 million over four days for not operating, at the expense of the state’s taxpayers.

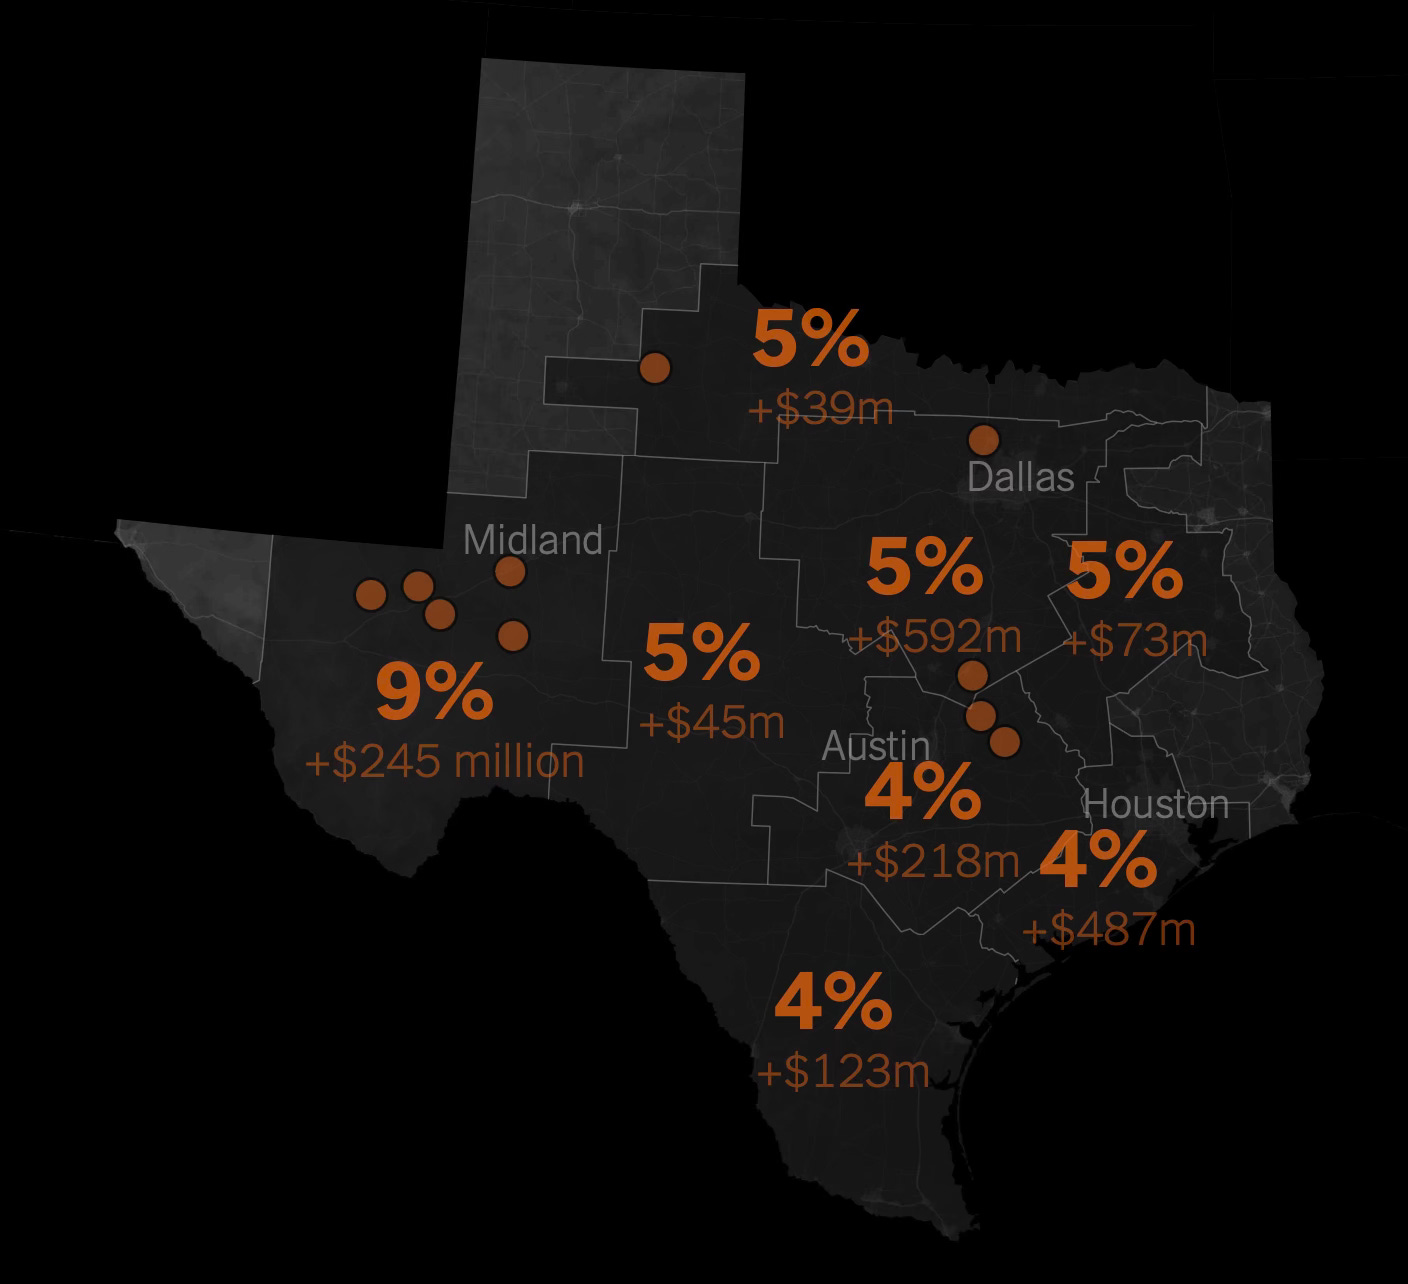
Here is a map showing the largest power users in Texas.

Bitcoin mines can use as much power as small cities do, with computers continuously refreshing their algorithms. China drove out bitcoin mines a few years ago because of their power usage but they have found a welcome home in many U.S. States.

Here is a map showing the number of households that use equivalent power to the nearby mines. 

In Texas local energy bills have gone up significantly.

Bitcoin defenders tout the jobs they are bringing to rural areas but while Ethereum, another cryptocurrency reduced their electricity use by 99 percent, Bitcoin has refused to change their algorithm. The heavy power usage is keeping us reliant on fossil fuels, greatly hindering our abilities to reach our climate and pollution goals. The whole story can be seen here.

Thursday, October 12, 2023

Pittsburgh Week

This week I am attending the North American Cartographic Information Society (NACIS) meeting in Pittsburgh so I haven't had time for a proper blog post. There's lots of great stuff here that may make for future blog posts but in the meantime here are a few random maps I've come across.

Here is a map of the original Fort Pitt, located on its site at Point State Park. The park and fort remains are located at the confluence of the three rivers (really two rivers coming together) and the location just feels  important. This is a look out from the point with another map in the ground, looking out at the newly formed Ohio River,

and a view from above on Mount Washington.

I got up and down Mount Washington via the two remaining incline railroads. Here is the busiest part of a map hanging at the incline station of all the historic inclines.

I took number 2 up and number 4 back down, the rest are gone.

Finally, a NACIS tradition is the quilt - using maps various members create of the host city, pieced together.


Wednesday, October 4, 2023

Seoul Maps

I found this nice collection of maps of Seoul, South Korea's largest city and capital from theSEOULlive. This is a website/magazine of Korean culture that "focuses on unraveling the hidden jewels of Seoul that can only be found with rumination." 

Unfortunately these maps are shown at a fairly low resolution so the details are hard to read. The maps vary from the purely pictorial,

to themed maps such as "Literature",

 "Mountain",

a map of medical facilities titled "Cure",

"Night",

and this schematic map with the river straightened out highlighting urban farming.

There is no easy link to the entire collection but you can browse them by clicking the Seoul Map dropdown at the top of theSEOULlive page and choosing the entries for 2017-2020.