
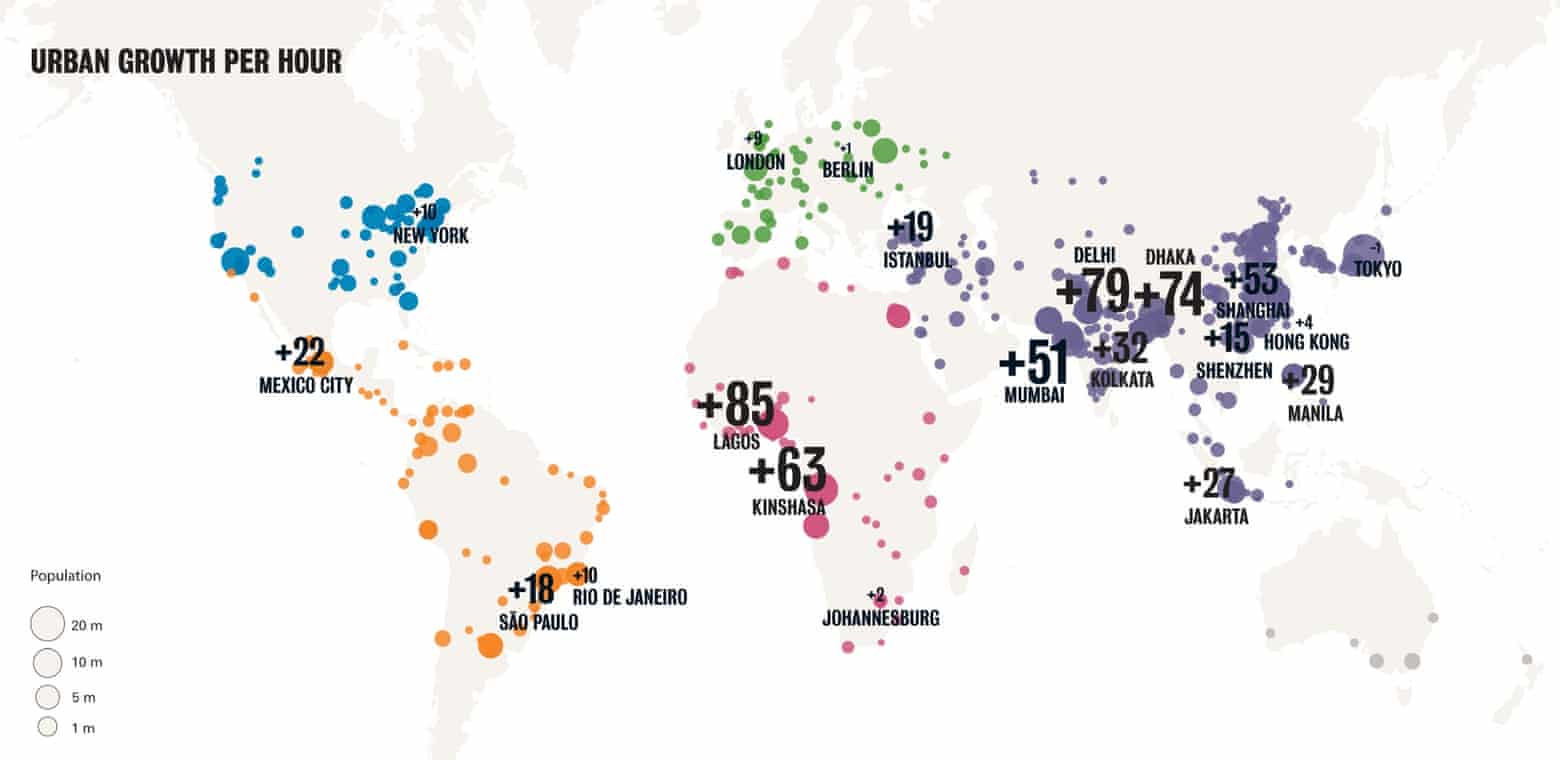
In 2015 The Guardian posted a couple of interesting maps highlighting the trends of urbanization. By 2050 the world population is expected to be 70% urbanized. Here is a map showing how many people are added each hour to the world's large cities.
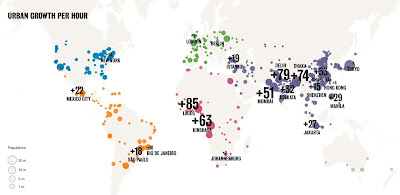 The data is from the London School of Economics Urban Age program. The map is a bit hard to read. Numbers are sized by city growth, making lower growth cities like London hard to read. Since the dots are already sized by number they could have kept the numbers all at a readable size. Also using a different color for each continent is somewhat pointless. Nevertheless the data is interesting-Lagos gains 85 new residents every hour while Rio only gains 10.
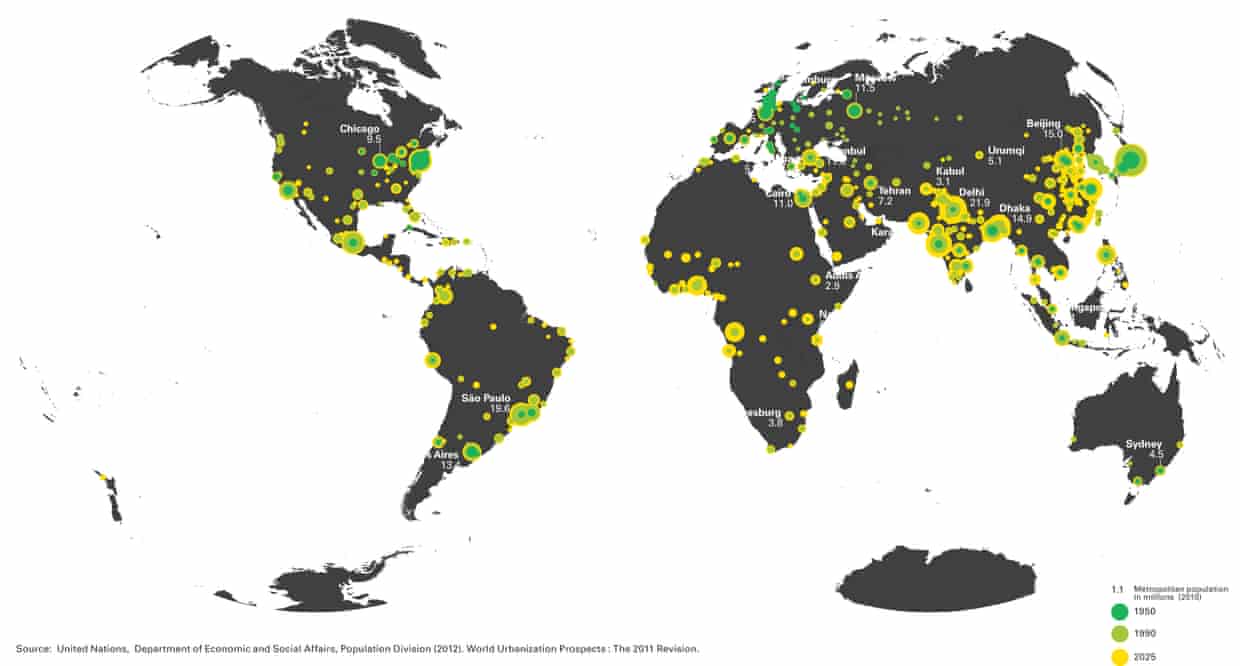
 The map below shows past and projected growth by time period.
 Green cities saw most of their growth occur by 1950 while the more yellow ones are currently seeing the most growth. Some cities, particularly in India have a more mixed pattern of concentric circles showing steady growth throughout past and future decades. These maps are a bit hard to read at this size. If you click on them, you can see larger sizes. Here is a detail from the map above showing Europe vs South Asia and East Africa.
 For much more on the urban footprint, environmental impact, economic development and land use see The Guardian


No comments:
Post a Comment