Showing posts with label baltimore. Show all posts

Tuesday, January 11, 2022

Redistricting Mini Golf

To show the absurdity of congressional district shapes, Dylan Moriarty and the Washington Post have designed this wonderful miniature golf game you can play online. 

Above is the Ohio 1st District. Republicans split Cincinnati into three districts to dilute that city's voting power. While not nearly the trickiest hole to play you have to squeeze the ball through the narrow gaps of Cincy.

The game begins in Wyoming, a state with only one district, therefore not one that can be manipulated. You can see from the layout that each district, or hole has an info box describing its demographics and voting patterns. 

The Illinois 4th District is famous for its "earmuff" shape, packing the Hispanic vote into the Midwest's only Hispanic-majority seat.

Indiana 7 is a trick hole. While the district looks very regular in shape, it is still designed in a highly political way by packing all of Indianapolis into it.

The toughest to play, by far is Maryland's terrible third. The water traps are completely unforgiving. 

You can see how I struggled with it by looking at my score sheet. Even with a generous par of 26, I was up to about my 50th stroke when I got caught in an impossible water situation and had to bail out.

Here is my final score sheet. I accidentally skipped the bonus hole-the original Gerry-mander in Massachusetts. This was my second go around so my scores on the other holes were pretty good. You have to play it at least once to get the hang of it. Have fun!

Wednesday, January 20, 2016

Apple Maps in 3D

The much maligned Apple Maps has improved its product in many ways. I bought a new computer for the first time in many years so I'm just discovering this not very new feature-the 3D models. They are accompanied by flyover tours of selected cities such as Seattle.

Apple acquired a Swedish company called C3 Technologies, that created 3D models of buildings based on aerial flyovers and guided missile technology. They were then able to quickly create a huge database of building models worldwide. Having tried to do this in SketchUp, (which I believe Google uses for their 3D buildings,) I have an appreciation for how much work each building takes. Unfortunately Apple's maps are only available on Apple devices. Google Maps has more extensive 3D coverage (and available to everyone with a web browser) but Apple's models are clearer and cooler looking. They also draw more smoothly.

Some gimmicks have been added. For example, In London Big Ben will always show the correct time, though it would be more accurate if it was lit up when it's dark there. Also, the London Eye is animated! 
Some more examples:
Sydney
Mount Rushmore
The Bromo Seltzer Tower in Baltimore
Here is a comparison of Google's vs Apple's 3D view of the above tower. Google's model is on the left.
Most articles online about Apple Maps are full of snooty comments about how bad they are. Google still has the edge over Apple Maps in many respects and StreetView is a huge reason to continue using them. However, in recent travels I've found Apple Maps more helpful for locating restaurants, hotels and other businesses. I use both of them (as well as Here Maps and even Mapquest) and do not strongly advocate one over the other but Apple Maps is definitely worth another look.

Wednesday, June 24, 2015

Baltimore 1815

Bearings of Baltimore Circa 1815 is a fantastically detailed interactive historic map of Baltimore. This 2.5 billion pixel image was created from a 3D model that was a 2+ year collaboration between the University of Maryland, Baltimore County (UMBC) and the Maryland Historical Society. The map is set in 1815, shortly after the Battle of Baltimore in the War of 1812 (though this battle took place late in 1814).
http://bearings.earlybaltimore.org/
When you click to go to the interactive map, you get a warning about needing Google Chrome, but it's worked for me in various other browsers and mobile devices. If you click on the sites at the bottom, you get automatically zoomed to that part of the image. The level of detail is pretty spectacular.


The highlighted text has pop-ups with more information about each site - including my favorite, the Mud Machine.
 There is also a 2014 overlay showing some of the current buildings for better orientation.

 Thanks to Maps Mania for alerting me to this fantastic site and distracting me for hours from what I really should be doing. Enjoy exploring!

The title BEARINGS is actually an acronym for Bird's Eye Annotated Representational Image/Navigable Gigapixel Scene.

Wednesday, April 10, 2013

Subways of North America

xkcd once again embraces their love of maps with Subways of North America. While I've seen similar subway map mashups, I've never seen them connected before.


These inter-city connections create some wonderful highlights. Here are some of my personal favorites:

The Cleveland Circle (Boston) to Cleveland shuttle - passing through West Trenton, this shuttle would be a nice easy way for me to leave work and go visit my Mom. West Trenton's location along Lake Erie just beyond South Harbor is also a bit curious.

The Green Line extension from Cambridge to Montreal - if it even makes it to Medford that would be remarkable.

The extension of the Market Street elevated subway line in West Philly/Upper Darby from 69th Street to Long Beach and LA.

The Rocky Mountain Tunnel (at sea level) connecting Chicago's O'Hare airport to Oakland.

A couple of extremely long subway tunnels from Atlanta and Miami to Mexico City.

The Puerto Rico submarine from Staten Island to San Juan and the connection from Jamaica (Queens) to Jamaica.

The Springfield Monorail connecting to nowhere, not even North Haverbrook.

There's lots of other things to explore including tunnels in the Caribbean,  "covertly repurposed" Amtrak lines, strangely renamed Red Line stations in Quincy, Mass. and a graveyard for passengers killed by closing doors - have fun exploring!

Tuesday, December 21, 2010

Map of the Week-Census Preview

Last week the New York Times put out this nice interactive map showing some of the latest data released from the Census Bureau. The dot maps are the most interesting. They nicely illustrate patterns of race:


and income:


The entire country is covered so you can zoom, pan or choose a location. If you zoom too far in you lose the patterns a bit and also get some misleading information because each dot represents multiple people, not individual households.


 To really see the patterns of segregation, zoom out.


Here's a larger city with a more diverse breakdown.


The income map reveals the inner city income holes that are prevalent in older cities like Baltimore, but less so in Washington D.C. where there is much more inner city wealth.


If you zoom out a ways the dots seem to follow county boundaries. Zooming in arranges them in a more realistic pattern. I'm not sure what algorithm produces that result.


Happy Holidays and may your next year be filled with new census maps!

Wednesday, March 3, 2010

Map of the Week-GPS Art

GPS Adventures has just opened at the Maryland Science Center in Baltimore. This is a life sized maze exhibit that introduces visitors to GPS and geocaching. In honor of the exhibit here are a couple of profiles of GPS-obsessed artists - people that create art from the tracks of their GPS units.


Jeremy Wood is a British artist and cartographer with a GPS Drawing web site. Here is a pentagram drawn from a series of consecutive flights beginning and ending at London's Stansted Airport.


"5414 miles in 68 hours for £74 from London Stansted airport to London Stansted airport" - was all this flying just to create a pentagram? He doesn't say.
      
He also leads GPS art workshops at schools, museums and festivals. Here is a map from a festival in Basel, Switzerland where participants spelled out the name of the city on the lower part of the map.


One day, he decided to enjoy a drink at the John Snow Pub in Soho. The pub is named after Dr. John Snow who produced the famous map that traced the 1854 cholera outbreak to a water pump just down the street from the pub. While there, his bag was stolen. His GPS unit was still in the bag and running. When the police returned the bag, he got back his unit and had a souvenir of his bag's travels. Here are the tracks of the stolen bag, overlaid onto John Snow's cholera map.


Over in San Francisco graphic designer Vicente Montelongo has created a series of GPS trail by bicycle in homage to the 8-bit video games of yore. Here are a couple of drawings reproduced for SF Weekly's "The Snitch." On the left is Space Invaders and on the right, Pac Man.

Wednesday, June 4, 2008

Baltimore Festival of Maps-Final Words

One final post about the Baltimore Festival of Maps and then I will get back to the normal Map of the Week schtick. My last two posts were about the Maps: Finding Our Place in the World exhibit at the Walters. However, this is a festival of maps and that means lots of additional events and exhibits, few of which I had time for after seeing the main exhibit.
I was really looking forward to the Maps on Purpose exhibition because I am a big fan of these type of community mapping projects. After all who can resist this map of the Oakenshawe neighborhood? Every few weeks they change the focus to a few selected Baltimore neighborhoods. My week the theme was "Neighbors". There were a number of displays about personal connections within neighborhoods, some of it based on the Arpanet map from the Maps exhibit. Interesting, but not very mappy. There was one cool map of the Hamilton Hills/Lauraville neighborhood.


The map shows income and other variables by block and is surrounded by pictures, stories and commentary by area residents. This was easily the highlight if this exhibition for me.
By the time I was able to make it to the Mapping the Cosmos Hubble Telescope exhibit I was exhuasted and all I coul do was stare at the pretty pictures. Some explanantion about the color manipulations used to create these would have been helpful but I wouldn't have had the mental energy to absorb it anyway at that point.
Of course there are lots of other things going on outside of the Walters including Borders & Boundaries: The Mason-Dixon Line at the Maryland Historical Society - a display of the original map showing this boundary. I did not have time to see this one but it's there until June 29th. I would also like to get to A People's Geography: The Spaces of African American Life at the Reginald F. Lewis Museum - this exhibit will continue until September 7th so there's still time. We did make it up to the top of the World Observation Level for 387 Feet Above, another community mapping type exhibit. It had a few interesting map ideas but the main attraction was the fab view of the Harbor from the 27th Floor. From up there I was able to map out the way out of town on a busy holiday weekend and with that I said a fond farewell to Baltimore and the Festival of Maps.

Sunday, June 1, 2008

Random Thoughts on the Baltimore Maps Exhibit

Since I don't have any overall brilliant statement to make about the Maps exhibit other than "wow that was really great", or "you should really go see this if you can", this is really just a collection of random musings. I can't show everything I liked because it would take too long so here's a sampling. Thanks to the Pond Seeker for helping me find some of these images. Some of them are on the Walters exhibit web page.


I spent lots of time staring at this Mercator map wondering how he got so much detail in Siberia - or did he just make it up? Then I finally looked at my own continent and saw how the St Lawrence River dips down into Texas and realized that of course he made it up. Gorgeous map anyway. That Antarctica sure is huge!

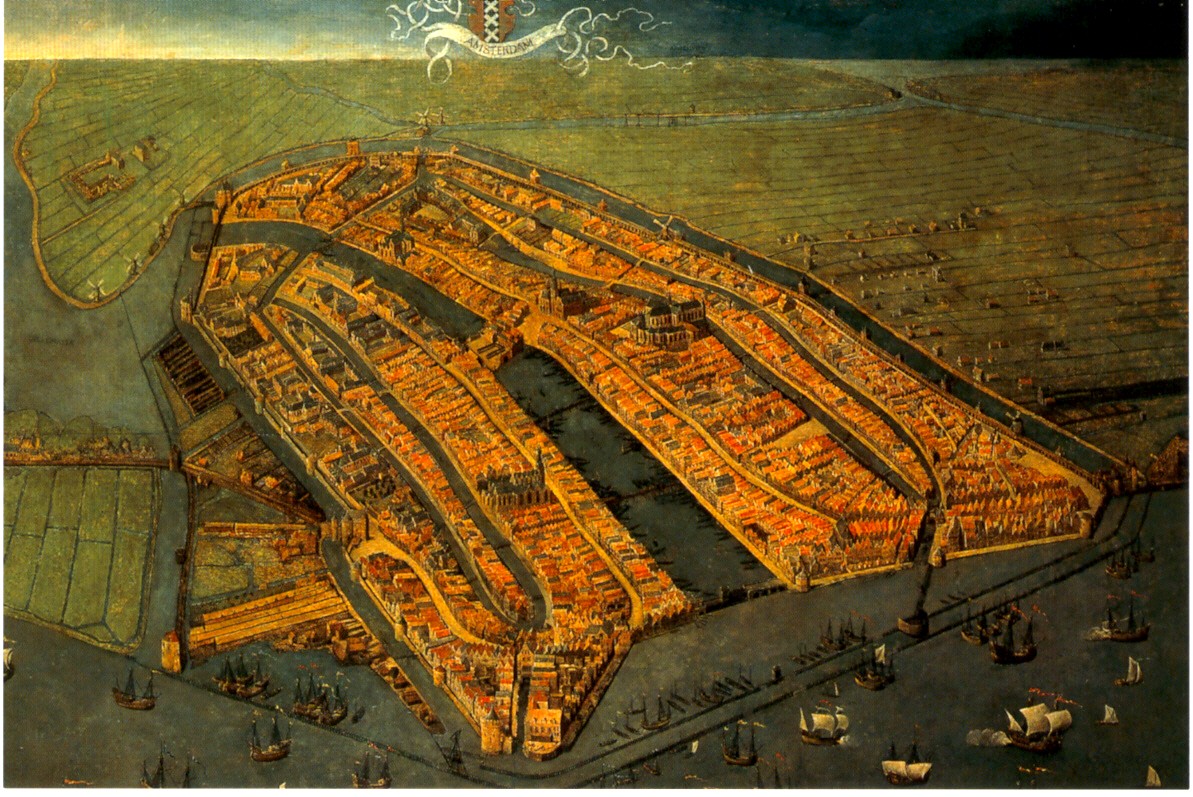
This oblique painting of Amsterdam was very large, striking and beautiful. This image is nice but can not convey the feeling you get when you're staring up at it on the wall. Go see for yourself!

This Buddhist world map (centered around mythological Mount Meru) offers a nice alternative perspective as did many of the other non Western maps. I also really liked a map that I believe I remember as having been drawn by the King of Cameroon though I can't seem to find any information on it from the web. They also had a stick chart from the Marshall Islands but I've already done that.

The lighting at the exhibits was poor in order to protect the maps but it made reading the details difficult. Maybe not a big problem for most people but I got a bit frustrated trying to see things.

Finally: The London Glove Map that was used in the promotional materials is really quite small. In fact it's the size of a glove. They tried to compensate by putting it in a large display case but that made it so you can't get close enough to it to read the details. Better to look at the pictures online if you want a good look at it.

Wednesday, May 28, 2008

MOTW @ the Baltimore Festival of Maps!

I finally made it to Baltimore for the Festival of Maps! The picture below is proof!

I spent a very good four hours at the Walters Art Museum (my normal museum limit is two) and could have spent even more time there if I had more stamina and fewer sleeping family members to consider. I could spend another four hours gushing about how great it was but I like to try and keep these entries manageable. If you want a really good, comprehensive review of the Maps: Finding Our Place in the World exhibit check out the Pond Seeker - his review is from the Chicago exhibit so it won't be identical but most of those maps are at the Walters also.
I will give a quick look at the highlights in this post and then maybe revisit the exhibit and other festival notes in a future post.

Logistics note: We drove down from Philly for the day-if I had it to do again I would have stayed overnight so I could have spent more time at the Walters and seen more of the satellite exhibits and events.

My favorite things from the exhibit were the more non-traditional maps, particularly this thing that looks like a back scratcher but is really an Inuit map of the coast of Greenland. Travel down the right side and you head south down the coast-as you go back up the left side you are heading further south. The shapes of the inlets are shown, but also the slope of the coastline is represented by the slopes on the wood so they had an idea of the coastal topography. Pretty clever-and we think they're primitive!

On the left is what is considered to be the "earliest known map drawn to scale" from Nippur, Babylonia - I had to steal this image from the Book of Joe - the blogging anesthesiologist. Thanks Joe!
There's so much more to say and show but it's very late so I will highlight more stuff when my mind is fresh!
Remember you only have until June 8th to see all this great stuff so hurry down to Bawlmor!

Thursday, March 20, 2008

Schmap of the Week

Schmap is a Widget you can add to your website to post info about your team, band, city, or other interests. Better to show then tell.


Below you can see the latest exploits of my favorite pathetic hockey team - the Flyers. Click a puck and see how they did in that location - you can also look at the arena - this works better in baseball when you're not looking at roofs. If you don't like them, which you probably don't, you can change the team or even the sport by clicking the buttons up top. Above, for a more international perspective is everyone's favorite French league team Paris St Germain.


You can also put up a city tourist guide - I picked Baltimore in honor of the Baltimore Festival of Maps.


Or you can follow your favorite musician such as Avril Lavigne - well she's not really my favorite but I sure like that heart-bone logo.

Thursday, March 13, 2008

Map of the Week 116-Baltimorrific!

For those of you like me who were foolish enough to miss the Chicago Festival of Maps, life has given you a second chance.
The Baltimore Festival of Maps begins Sunday with the opening of Maps: Finding Our Place in the World. This is the same exhibit that appeared at the Field Museum in Chicago, now making an east coast appearance at the Walters Art Museum in Baltimore. The Walters chose the London Glove map to represent their various mapping exhibits (there are several other exhibits and events going on at the museum).

As a fan of maps made by non-professionals, I'm really looking forward to seeing the Maps on Purpose exhibit. Art on Purpose, a community arts organization led various neighborhood map making workshops. Below are a couple of samples. Unfortunately the resolution on them is pretty coarse.


Of course I was curious to see where these neighborhoods are so I located them on yahoo maps. I used yahoo because I'm partial to their "micro-neighborhoods" even though they're often wrong. The map on the left is in Sandtown-Winchester, in the top right (NW) part of the map. The map on the right shows the Hollis Market-Union Square neighborhoods at the southern edge of the map.
One thing I have not found on the festival site is a map locating the events. Maybe someone (her majesty?) knows something I don't. I took the map below from yahoo and outlined in purple the area of the neighborhood map above and marked the Walters in a red asterisk. Now you know where to go and what to do. See you there?