Wednesday, August 29, 2018

Aerosol Earth

NASA's Earth Observatory created this stunning image of aerosols - airborne particles and liquid droplets.
https://eoimages.gsfc.nasa.gov/images/imagerecords/92000/92654/atmosphere_geo5_2018235.png
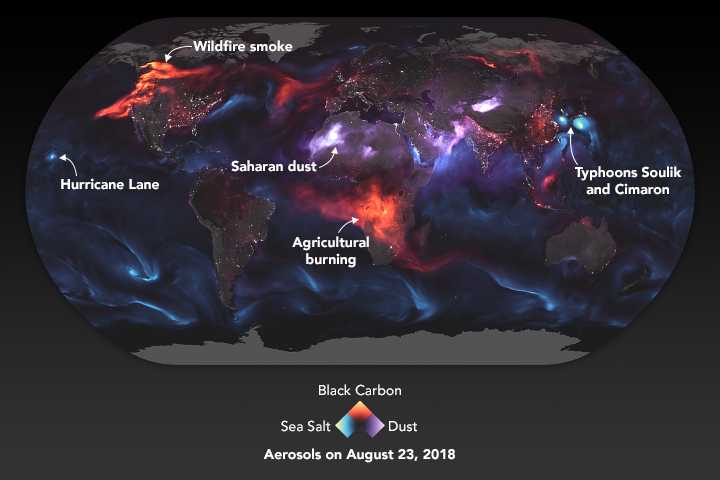
These aerosols "range in size from a few nanometers—less than the width of the smallest viruses—to several several tens of micrometers—about the diameter of human hair. Despite their small size, they have major impacts on our climate and our health." - via NASA aerosol page

In the image above blue represents sea salt. The concentrated areas show major storms, particularly two cyclones off the coasts of Japan and Korea and a hurricane approaching Hawaii. Red indicates black carbon, mostly from agricultural burning in Africa and Wildfires. Purple is dust, mostly from deserts. Also included is a layer of white night light data to indicate urban areas. Here is the legend enlarged for emphasis.
The NASA page includes a zoomed in detail from southern Asia, emphasizing the deserts, cyclones and population centers of the area.
More from NASA here.

Wednesday, August 22, 2018

Cockney Sound Map

The geographic definition of a Cockney (London's most beloved and belittled accent) is someone who was born within earshot of the church bells of St. Mary-le-Bow. The church is centrally located in the Cheapside district. The tremendous increase in ambient city noise has shrunk their area quite a bit over the years.
https://wi-images.condecdn.net/image/y9pyAV1GGaa/crop/1620/f/bells.jpg
This "sound map" via Wired was compiled by noise consultants 24 Acoustics. 150 years ago the bells could be heard in much of the city (the green areas) including some areas across the river. As noise has increased from traffic, construction, airplanes, air conditioners and other symptoms of urban life, the area where you can hear the bells has shrunk down to the blue section. The shape and reach of these areas is affected by wind direction.

The sound-shed is now so small that there are no longer any maternity wards located within earshot of the bells. That means no more babies are being born as cockneys (unless born at home, or on the way to the hospital). Out of concern for losing cockney culture one area vicar backed a plan to make an MP3 audio file available to would be cockneys. This is available from the Times Atlas of London according to this article, however the link is broken. You can hear them on YouTube.

Wednesday, August 15, 2018

Rivers of Plastic

There has been a large increase in both the amount of plastic in the oceans and in public awareness of the issue. National Geographic and Nature have both done a good job of covering this issue. Cartographer John Nelson made a wonderful map, inspired by the rivers/mountains type of diagrams that I recently featured here, showing the three most contributing rivers in that style.
https://adventuresinmapping.files.wordpress.com/2018/08/threeprincipalriversofplastic.jpg
For better resolution click above - here is a detail from the Yangtze River.
I like how he managed to give this not only an old style look but also make the river colors and textures look a bit like plastic.  Also it is worth noting that the boxes on the bottom of each river represent the weight of about five cars, this weight is multiplied by the number of boxes EACH DAY.
For more on Nelson's map click here


National Geographic also recently published an excellent graphic story on this subject. Here are rivers with circled sized by level of contribution of plastics,
https://www.nationalgeographic.com/magazine/2018/06/the-journey-of-plastic-around-the-globe/
and here is a graphic view. This is just for Asia,
and here is the rest of the world.
Note that the scale on the two above images is close but not exact. To see these side by side scroll through the article.

Finally, a map of the Yangtze basin showing the sources of mismanaged municipal plastic waste.
https://www.nationalgeographic.com/magazine/2018/06/the-journey-of-plastic-around-the-globe/


Wednesday, August 8, 2018

Sheep and Wheat

Sheep and wheat together.
This charming map, downloaded from the National Library of Australia is one of a series of maps by geographer Thomas Griffith Taylor. It is one of a series  from the 1920's called "The New Oxford Wall Maps of Australia." Taylor liked to show multiple variables, in this case density of sheep in green overlaid with wheat in a black line pattern. Helpful text tells you where there are "No Sheep" and "Some Sheep" with a thick boundary separating the sheep and non-sheep areas.

Also, though there is some shading in Tasmania, there are "no very important wheat areas" there. Similarly, here are cattle and minerals.
Cattle follow a similar pattern to sheep (neither animal does well in the desert) except in the north where cattle do better. The "V.F.C." and "FEW" text bits add charm. Minerals are identified mostly as points rather than areas, except for some more defined gold areas in the west.

Here is his vegetation map. There is a lot of Mulga. I had to look this up - it refers to bushy, sandy lands containing mulga trees, a type of acacia. Mallee, common in the south is a semi-arid climate region with scattered eucalyptus trees.
More of his maps can be seen on this page from ABC (Australia) news.

Friday, August 3, 2018

Random City 1

Last night Maptime Boston helped me indulge my occasional hobby or hand drawn maps. Here's the map I did.
I had no thoughts ahead of time of what to do but I started with a river, then thought about where the major roads would need to go and it took off from there. I tried to create a nicer north side and more industrial, gritty south side (sort of London-esque) but ended up making some nice parts of the south side too.


Wednesday, August 1, 2018

Pirates of the South Atlantic

This map is from imgur. Like so many things on that site, there are no credits. I like the exaggerated rivers and goofily drawn state boundaries.
[Map] Pirates of the South Atlantic and their flags