Showing posts with label water. Show all posts

Wednesday, August 13, 2025

Our Drying Planet

A recent study in the journal Science and illustrated by ProPublica details how the Earth’s land is drying. Water is being diverted to the oceans by melting glaciers, agricultural runoff and by pumping aquifers. The story incorporates a spinning globe as you scroll down, highlighting problem areas

Earth’s supply of fresh water is quickly disappearing leading to a “a critical, emerging threat to humanity.” Aquifers are being pumped out causing groundwater depletion. This has become one of the largest contributors to sea level rise and is causing the land to sink as shown dramatically by this illustration.

Some of the world’s most important food producing areas such as the Nile and Mekong River deltas are threatened. This subsidence is also happening in many major cities, compounding the flooding problems that are increasing due to rising sea levels. 

The ProPublica story includes maps showing global water loss as well as these problem areas of North and South America.


The scarcity of water is being used as a weapon in many conflict zones around the world the world. Without a global framework or governmental regulations these problems will continue to grow. The article mentions some policies that have worked, at least temporarily and suggests that a policy that looks at water as a national security concern, may be able to counterbalance special interests and forces of habit. Scroll through the ProPublica site for more details and illustrations.

Wednesday, November 27, 2024

The Salt Front

The salt front is the point where a river becomes too salty to be safe for drinking water. The front moves upstream from the river’s mouth as less freshwater flows downstream to dilute it. I’d never heard of a salt front until I read about it in a recent article in the Philadelphia Inquirer. The region’s severe drought in November caused this front to move significantly further upstream than the median monthly location.


On the map above, via the Delaware River Basin Commission (cropped for ease of reading), the pink area is the median salt front location and the pink arrow shows the normal location of this front in November, near Wilmington, Delaware. The blue arrow shows the location as of November 18, 2024. 

The DRBC monitors freshwater flows to keep the salt front from migrating too far upstream. This protects drinking water and industrial water intakes. There are major drinking water intakes for both Philadelphia and New Jersey at the blue box on the map. One way to keep freshwater flowing is to release water from various upstream dams.

The worst droughts were in the mid 1960’s-this shot from one of their videos shows the most upstream movement of the front on November 20, 1964,


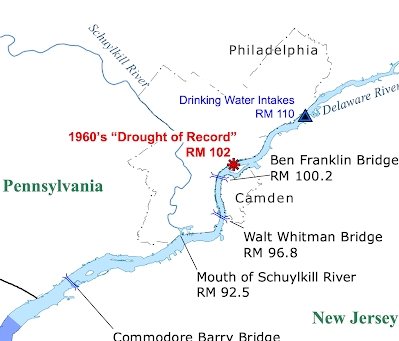
and here is a still map showing more specifically the salt front’s furthest upstream location during the “drought of record”


Finally, here is a screen shot from the hydrologic conditions dashboard, showing conditions on November 23, 2024.


Thursday, September 21, 2023

Hidden Hydrology

In my day job I've mapped buried streams to give an indication of areas that are most likely to flood in major storms. It turns out that buried streams in older urban centers is common everywhere. Hidden Hydrology is a great resource for exploring disappeared waterways throughout the country. I stumbled across their extensive PhillyH2O page. Here are some maps, from the extensive Water History PHL site.

The map below shows just how few of the original streams (in blue) remain and shows the sewers that have replaced these streams in red.
 

An inset from the Lenapehoking Map, mentioned last week also does an artistic job of showing these same waterways.

Here is an 1895 map from the Water Department showing the proposed and existing sewers and how they head for and follow streams to take advantage of the gravity flow.

Here is an exaggerated topographic model of the city

Finally a diagram of Frankford Creek. The "A Snake That Will Be Straightened Out" says everything about the attitude of conquering nature that was prevalent at the time.
There's plenty more to read about Philadelphia's water system here and other cities here.

Wednesday, October 11, 2017

D.C. Water Atlas

This atlas shows the development of Washington D.C.'s water system.
http://doaks.org/resources/d-c-water-atlas

Here is a quote from the atlas page on Dumbarton Oaks, the project's host institution.
As in so many other cities, water is everywhere in Washington, D.C.—and yet it remains largely invisible to most of us, taken for granted or ignored. But D.C.’s waterways and plumbing shape the civic, social, and even commercial lives of its residents just as much now as in the past: the Anacostia, the Potomac, the C&O Canal, Rock Creek. And the crisis in Flint, Michigan, has shown that the questions of where and how cities find their water have tremendous importance for public health, down to the last pipe.  
Unlike many modern web maps, this one is refreshingly free of the usual over-reliance on interactivity. Most of the maps are a simple click or two away. The menu at the top shows the options.
You can also hover over different areas on the main map to get these options.
After choosing an option, there are sub-maps that can be chosen such as this one for the City Canal.
These sub-maps are simple (not interactive) maps with an information panel in the upper left and the year depicted shown at the bottom. The author, John Dean Davis, scanned a series of historical maps and overlaid them onto the modern city. He included some nice details such as the campus of Dumbarton Oaks.
I'm not sure I would have chosen the blueprint color scheme for these maps. Some of the information is a hard to read but it does make for a nice effect and ties the maps together visually.

To explore this further go to the online atlas.