Showing posts with label middle east. Show all posts

Wednesday, February 23, 2022

Al-Khwārizmī's Geography

Persian polymath Muḥammad ibn Mūsā al-Khwārizmī (c. 780-c. 850) had a huge influence on the development of algebra, the Hindu-Arabic numeral system, astronomy and cartography. His Kitāb Ṣūrat al-Arḍ (description of the Earth) was a major reworking of Ptolemy's Geography correcting much of his data for The Mediterranean Sea, Africa and Asia. Here is the earliest known map of the Nile River from that work,
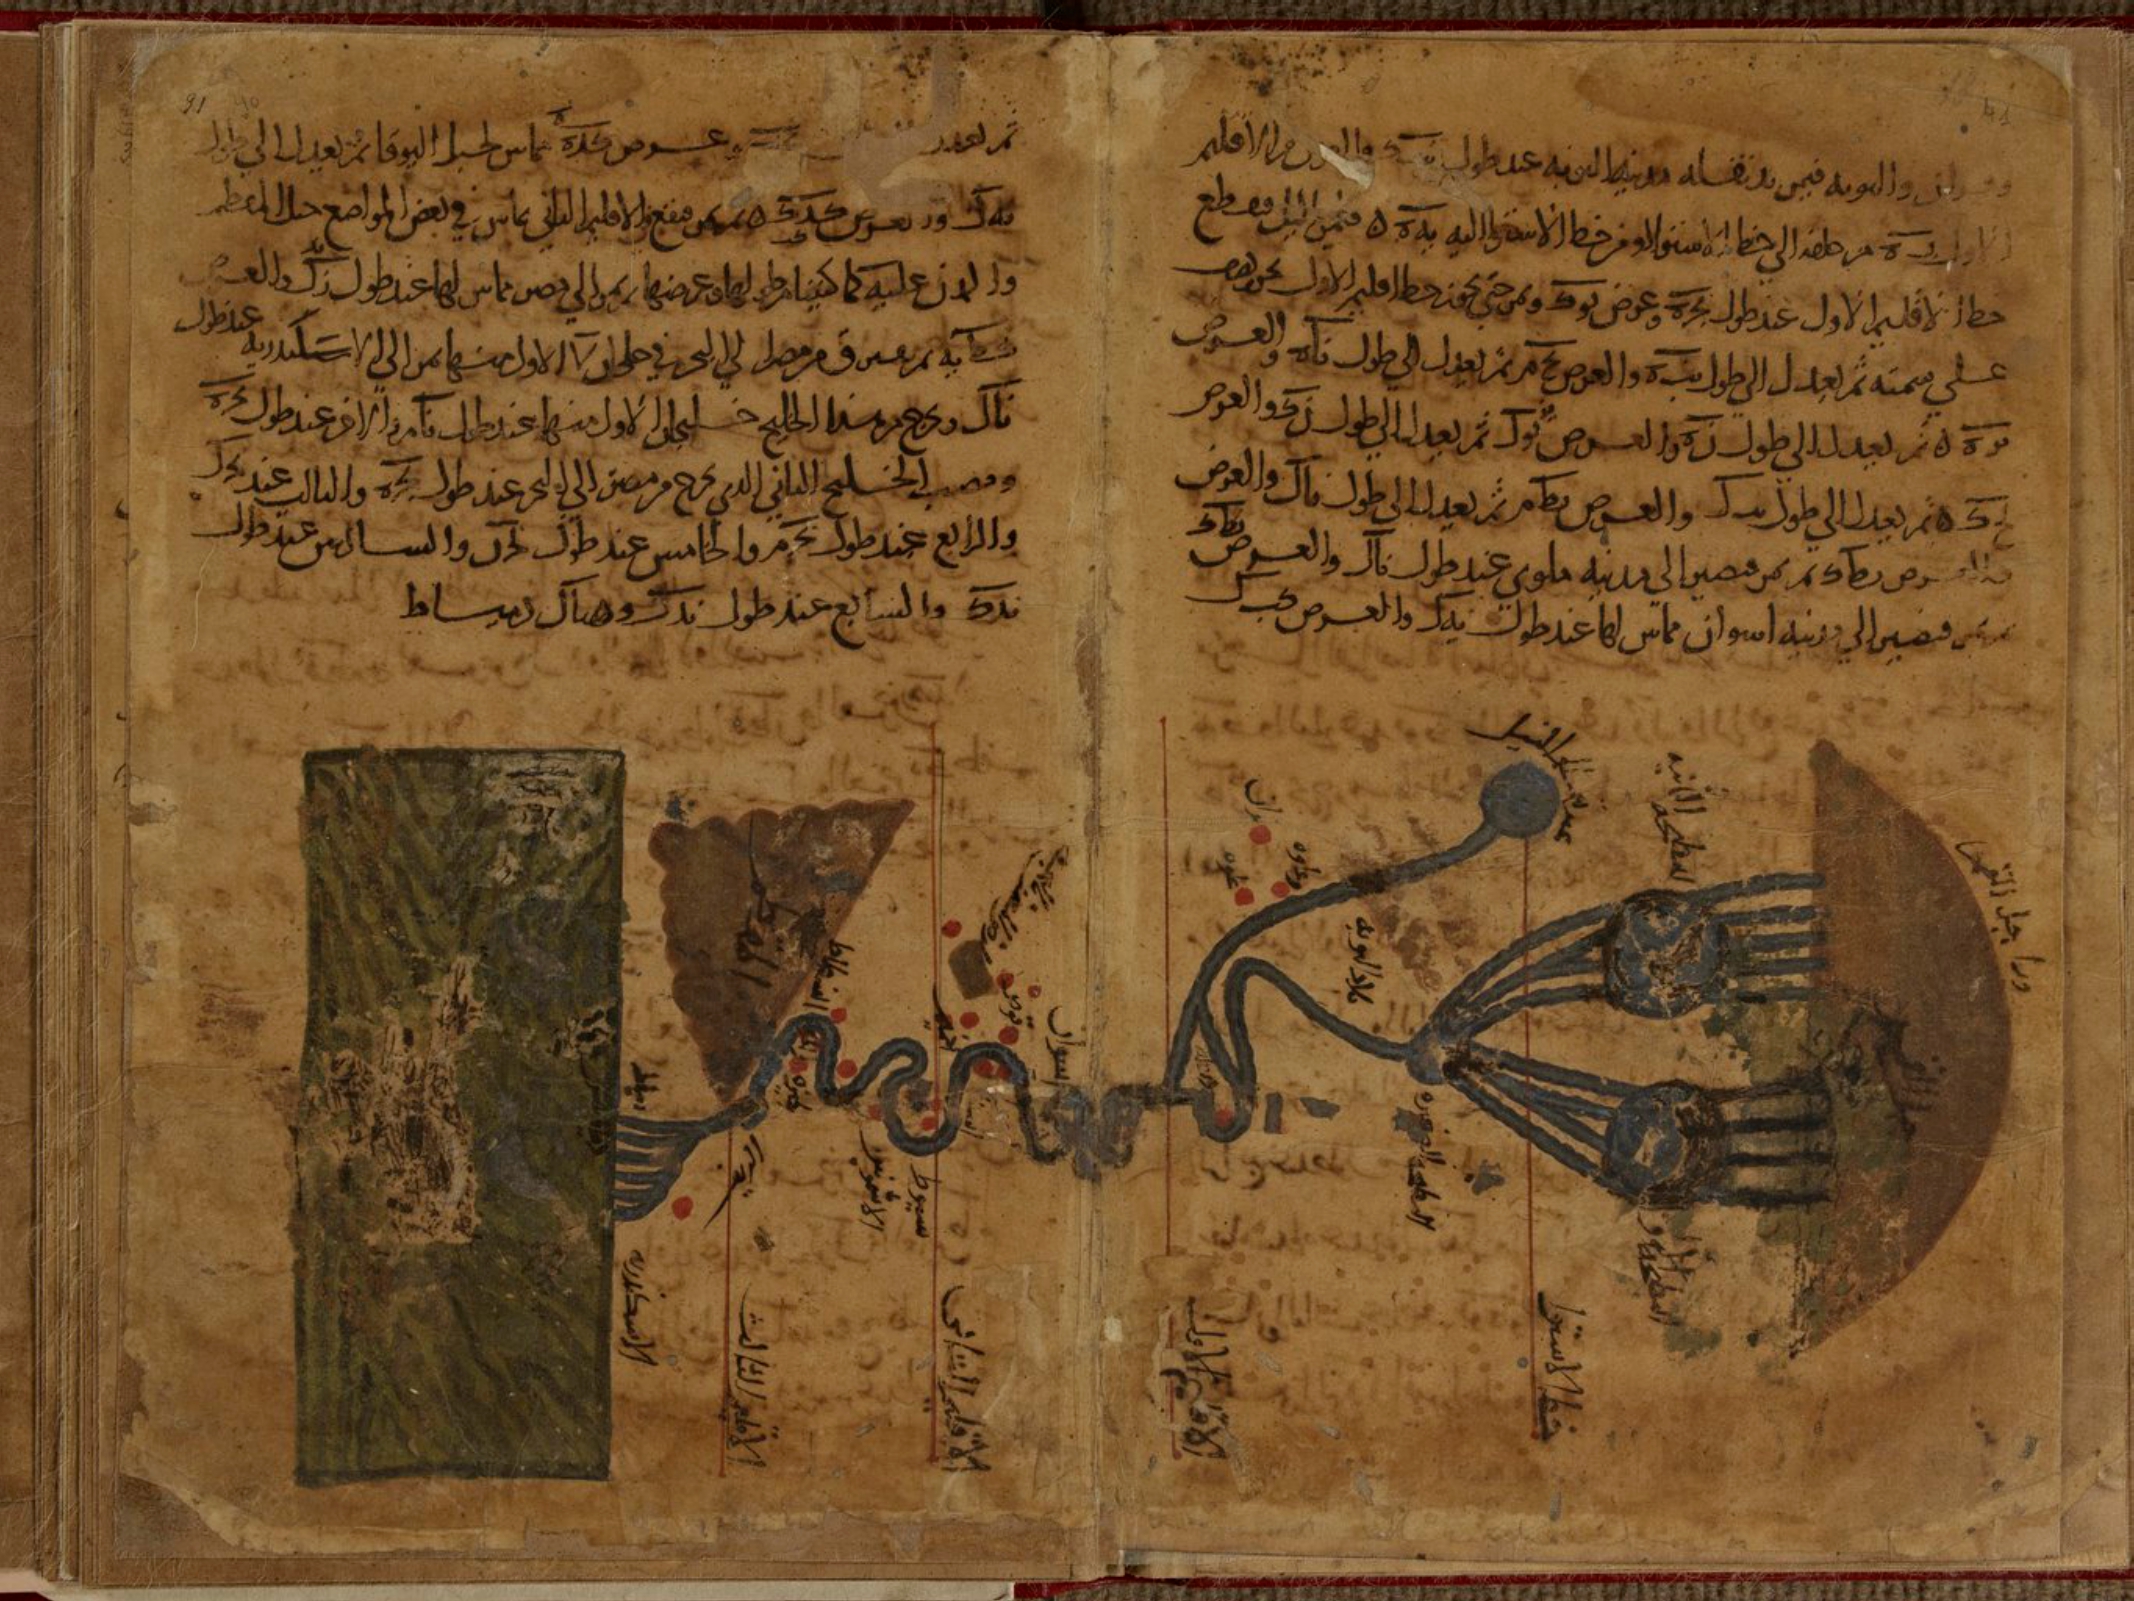
some nice details of the origins and branches of the river, 

and the delta where it meets the Mediterranean.

The only surviving copy of this book is in the Strasbourg University Library in France. The copy is in bad shape and parts are almost illegible. Though latitudes and longitudes of thousands of places appear the world map is missing. Historian Hubert Daunicht reconstructed this map, the only copy I can find is this low resolution version from Wikipedia, showing the Indian Ocean.

For fans of "World Music" a band called Guess What named an album Al-Khawarizmi (with a slight spelling difference). The cover includes an early Islamic world map in the lower corner.

A previous post on this blog has a partial explanation of some of the elements of this map.


Wednesday, January 25, 2017

Early Islamic Maps

Karen Pinto's new book Medieval Islamic Maps; An Exploration covers a very overlooked school of cartography.
https://www.amazon.com/Medieval-Islamic-Maps-Karen-Pinto/dp/022612696X
These maps are more representational than geographic, following the early Christian T-O maps. In an interview, Pinto describes the typical world map as having the form of a bird. The map on the cover puts south at the top. The white land areas are the bird's features: Africa is the upper wing, the Arabian Peninsula is the head, Asia is the body and Europe (the tiny triangle in the lower left) is the tail. Here is another version by Al Istahkri from cartographic-images.net circa 977 AD.
http://cartographic-images.net/Cartographic_Images/211_al-Istakhri.html
The large water body on the left side is the Persian Gulf and Indian Ocean. The teardrop shaped water on the right side is the Mediterranean Sea. The Nile is shown sticking up from there while below the Mediterranean is the Bosporus Strait. Rivers coming down from the Sea on the left are the Tigris and Indus. Both seas are shown containing three large islands, it is not always agreed which ones they are. Other important water bodies in the lower half of the image are the Caspian and Aral Seas. Another image from cartographic-images.net  helps translate the place names.

There is no scale on these maps but Al Istahkri lists distances between places in marhalah (a day's journey.) A journey through the inhabitable world was 210 days. The far north and south were considered uninhabitable because extreme cold and heat respectively. The southern hemisphere was unknown to these travelers.

Pinto discusses how scholars have often belittled these maps for their simplicity while ignoring that they are iconographic representations, meant to promote a common world perception. The simple forms also made them easy for traveling scholars to reproduce and bring back to their home libraries.


Tuesday, May 24, 2016

Lady Anne Blunt in Northern Arabia

In March the Library of Congress posted a series of maps for Women's History Month on their geography and map blog. Their last post was a map showing the journeys of Lady Anne Blunt through northern Arabia.
https://blogs.loc.gov/maps/2016/03/lady-anne-blunt/
Blunt was a British noblewoman who was famous for helping to save the purebred Arabian horse by buying and bringing horses to England. She was the first European woman to cross the Arabian desert in pursuit of these horses. As an interesting side note her mother, Ada King-Noel, Countess of Lovelace is often regarded as the first computer programmer.

Blunt was not a cartographer but her place-specific descriptions of two journeys, in 1878 and 1879, allowed Edward Stanford, a London bookseller and mapmaker (creator of Stanfords Travel Guides) to create this remarkably detailed map.  It shows not just the physical geography of the land, but cultural features such as irrigation and grazing practices, tribal relations and pilgrimage routes.
Here are a couple more zoomed in views.

You can browse and/or download the entire map online at the Library of Congress.

Wednesday, December 9, 2015

Muslims Don't Support ISIS Either

We get a lot of confusing results when looking at how much support ISIS has in the Islamic world. This is because large numbers of unscientific opinion polls show widely differing results. Metrocosm created this map, based on six different scientific polls.
http://metrocosm.com/support-isis-muslim-world-perceptions-vs-reality/
Except for Syria, support for ISIS is very low - even 0% in Iran and Lebanon.* Contrast this with the perceived support in the United States:
http://metrocosm.com/support-isis-muslim-world-perceptions-vs-reality/

These are the types of perceptions that cause rednecks to throw pig's heads at mosques and this illustrates the dangers of the media relying on social media and other non-scientific opinion polls.

I am no expert of what makes a poll "scientific" but the questions and polls cited for the above map can be found here.

* 0% in any poll should arouse skepticism.

Wednesday, December 11, 2013

The Islamic World


Columbia University's Gulf/2000 Project was created as a service to scholars, journalists, politicians and other professionals working in the Persian Gulf region. The web site for this project contains some fantastic maps created by Dr. Mehrdad Izady showing population, religion, language and other divisions that affect the region.

His large map of the Islamic World is particularly striking. Many of the recent conflicts in the world have occurred along the boundaries of Islam and other religions such as in Mail, Nigeria, Central African Republic, Sudan/South Sudan, the Caucasus region and in parts of India and Pakistan.
http://gulf2000.columbia.edu/images/maps/Islamic_World_Basic_lg.png
The lower right corner of the map contains a 1907 map depicting the extent of the "Moslem World." The overall pattern is largely the same as today.

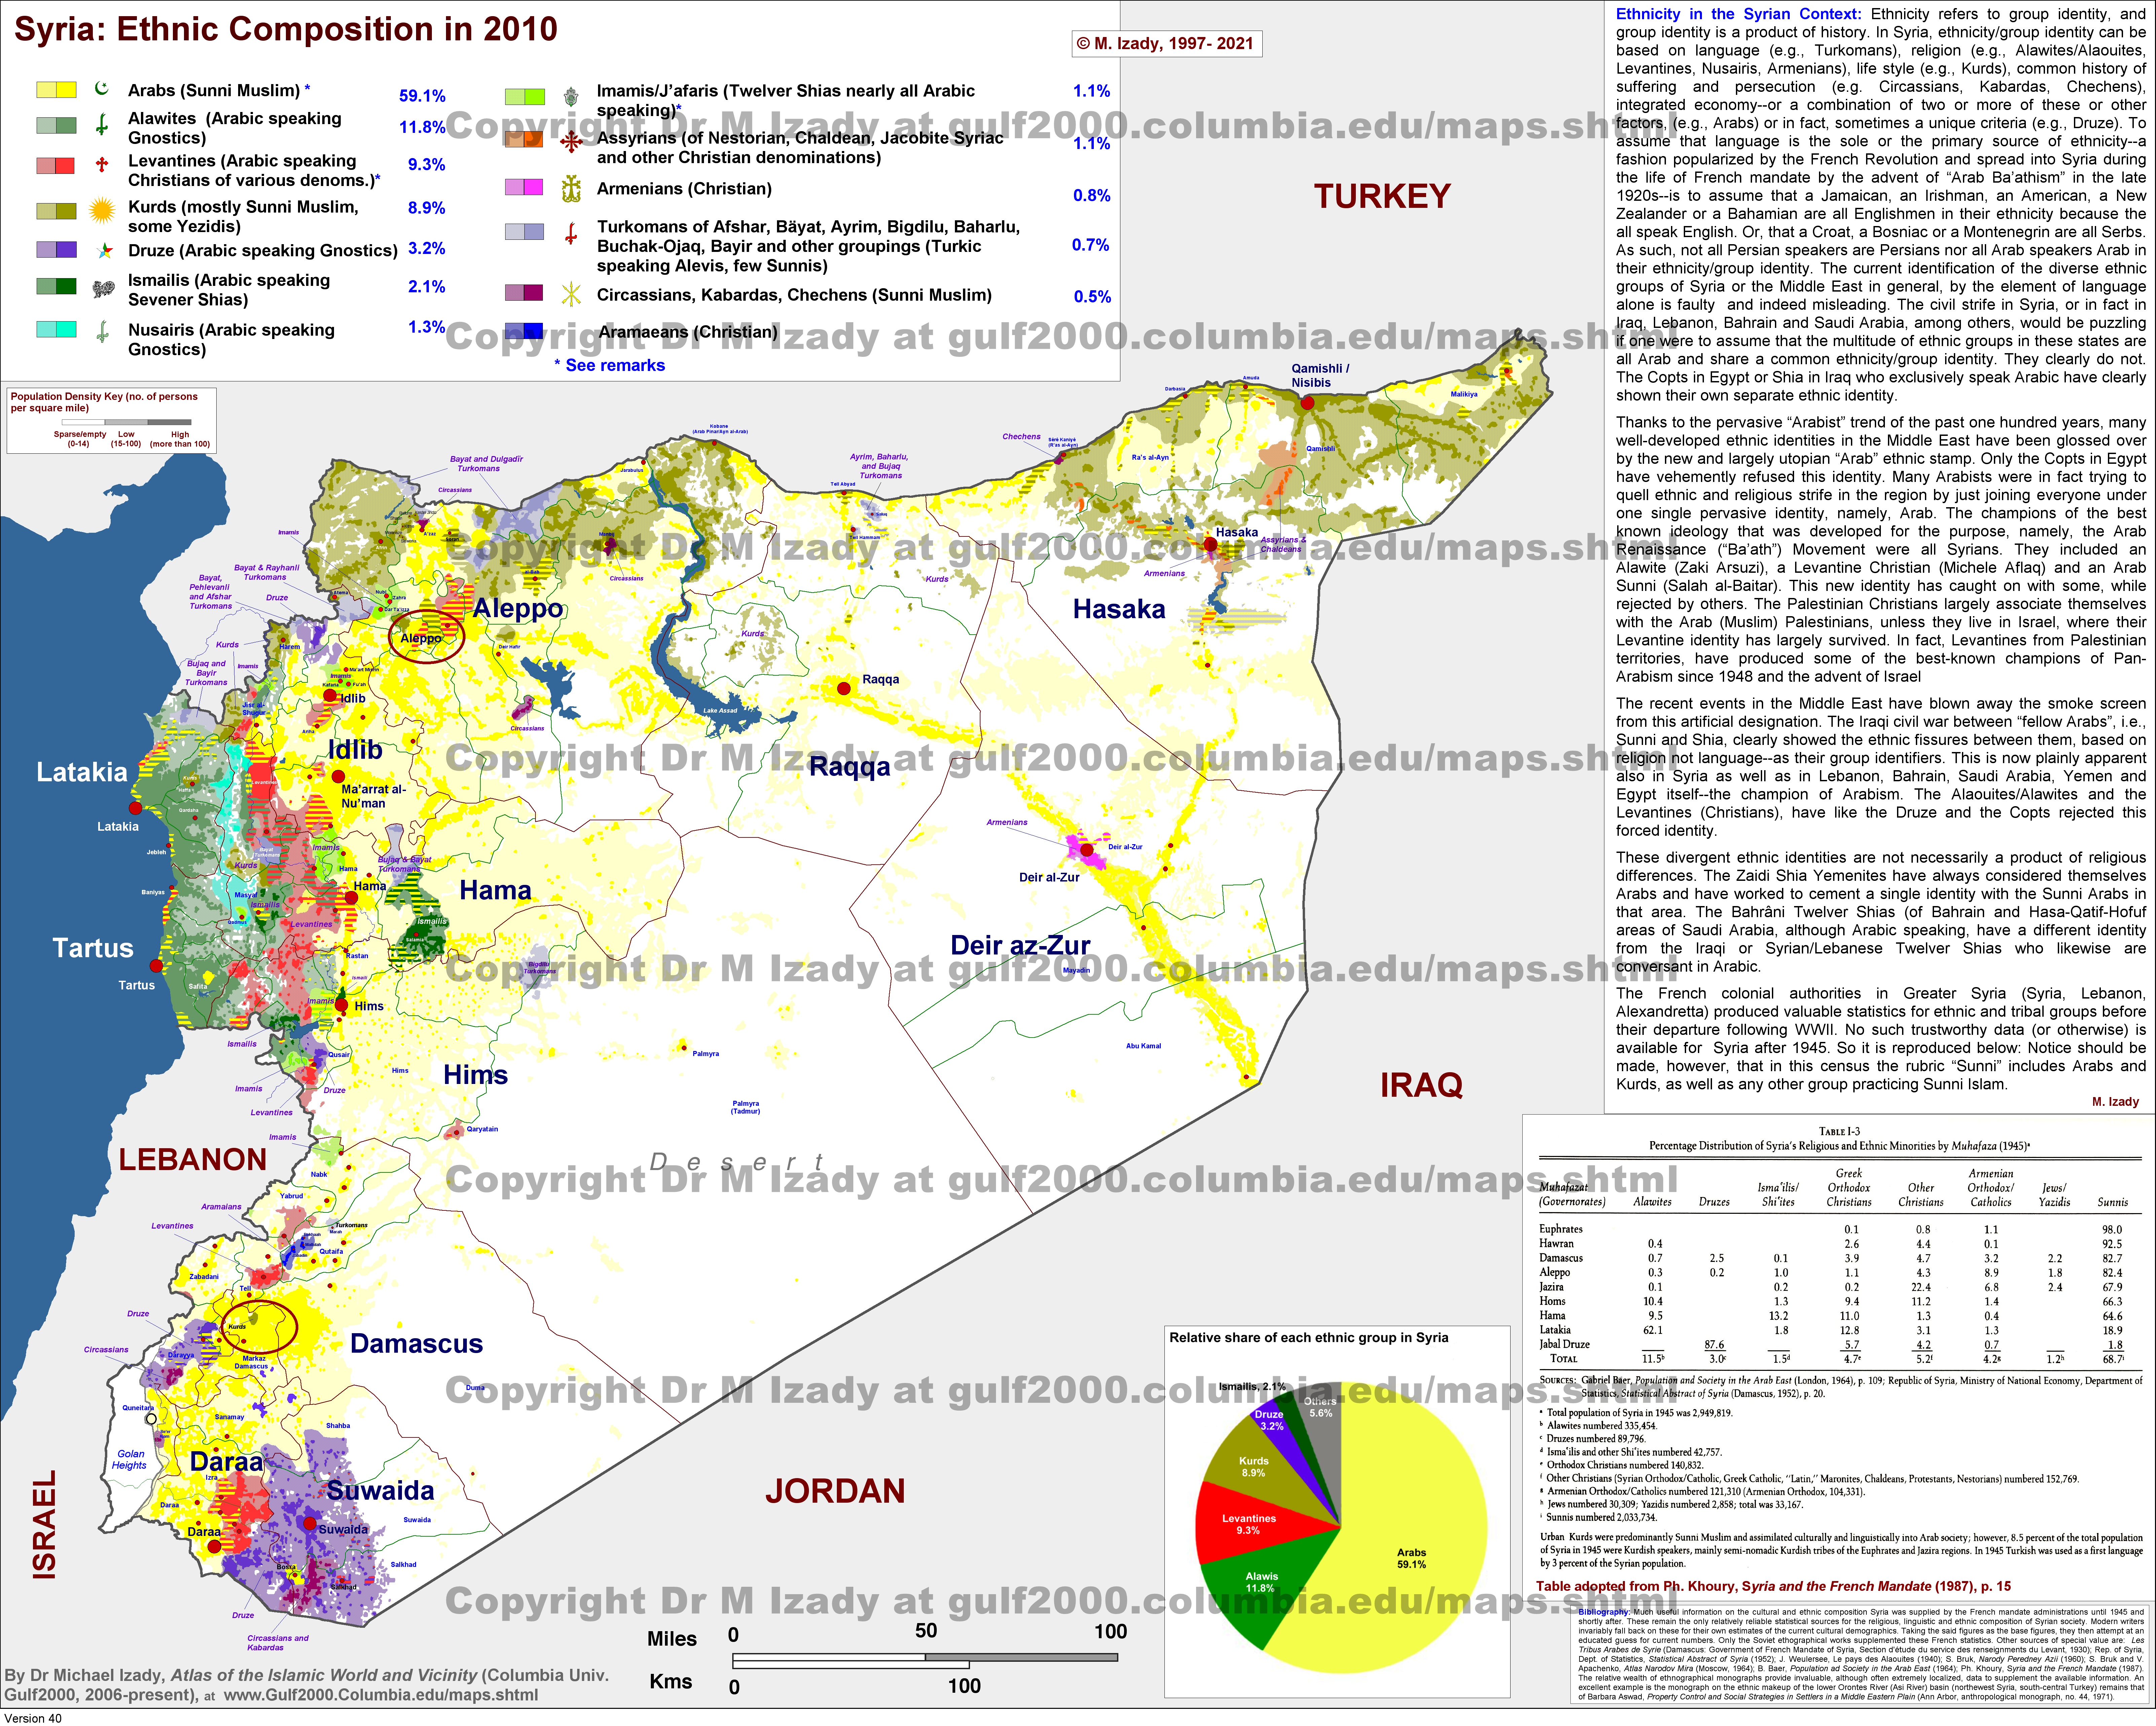
"Syria Ethnic Composition" is another very detailed map showing how diverse that country is. The text on the right describes how much of this complexity is lost when language is considered the defining ethnic characteristic. The commonly used "Arab" ethnic stamp glosses over these divisions but the current conflict in Syria has shown their significance. 
http://gulf2000.columbia.edu/images/maps/Syria_Ethnic_Detailed_lg.png

The maps page has many other highly detailed maps not just of the Gulf region, but the entire Middle East as well as parts of Africa and Asia. You can spend hours looking at these. I did. 

Thursday, January 3, 2013

Mapping the Evolution of Stories

A few years ago Lapham's Quarterly mapped the evolution of four famous stories; Pygmalion, Faust, Oedipus and Leviathan. These stories all originated in the eastern Mediterranean region (modern day Turkey, Syria, and Libya), spread their way through Europe and eventually made it to the United States where they were all Hollywoodized, or otherwise Los Angelified. In each case the story has been modified but with the exception of Pygmalion, most have stayed fairly true to the format of the original.

This map is big and hard to see in much detail here (a click will take you to the original) so here is a detailed view showing the origin of each story.


Wednesday, April 11, 2012

Handy Map of the Middle East

Confused about what's going on in the Middle East? This map from the Economist will clarify things.


Wednesday, October 26, 2011

Tunisian Election Irregularities

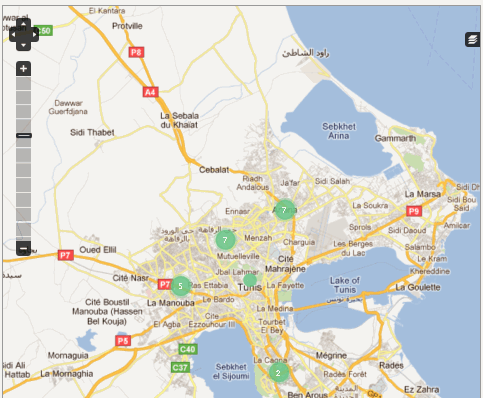
Tunisians voted this weekend for the first time since their revolution. I was hoping to find an election results map to see if there were any regional patterns to the vote but the results are not all in yet. What I was able to dig up was this interactive map of voting irregularities from ISIE, Tunisia's independent election commission.


 While it looks numerous, many of the irregularities are fairly benign acts like tearing down posters, not entering the voting booth in isolation, and using the flag-whatever that means. The violence and threat categories are either mostly empty or some data is missing. In fact, many of the categories are fairly empty. The above map shows all incidents. The map below shows "violation of silence" if my bad French comprehension is accurate. I chose this category because there are lots of incidents. The violence and corruption maps are pretty boring by contrast.

As you zoom in, the larger circles spread out to show more precise locations.

You can also change the basemap. I switched from the default aerial view because I find the street map easier to read. The only problem is the highway markers start to look like incidents.

If I find an interesting election results map I will put it in a future post.

Thursday, December 11, 2008

Map of the Week-Filling Empty Space

King Abdullah University of Science and Technology (KAUST) is being built on an empty desert landscape around the village of Thuwal, Saudi Arabia. They have put together this interactive map (takes a minute or two to load) as a recruiting tool. In their own words:
"Just launched this month, the map offers students, faculty, research partners and community members the opportunity to explore the university via an immersive and cutting edge digital map, highlighting everything from residential flats, lab and research facilities, sustainability features, community services, recreational facilities, flyover video and more.
Currently the interactive map's main purpose is that of a recruiting tool, something which differentiates it from virtually every other campus map. Rather than showing students how to get from point A to point B, however, the map serves to share the KAUST story with them. Also, KAUST is using the map to showcase its commitment to sustainability by highlighting the green aspects of every building."

The map allows you to switch between the plans for the university and an aerial view (left) and is "the only physical link to an entire institution which does not yet exist."


This empty piece of desert is rapidly being transformed as this recent photo shows.

Soon it will look like this:

Thanks to Jason Hellman of Fleishman-Hillard for the above comments.

Wednesday, September 17, 2008

Map of the Week - Trust the Experts

This map in today's Boston Globe reminded me of Middle East expert John McCain's various gaffes (Iran, Iraq, Sunni, Shiite, who can tell the difference?) Here's a map of his "Iraq-Pakistan Border" courtesy of Matthew Yglesias and the Atlantic Monthly.

Thursday, February 21, 2008

Map of the Week 113-L(a)titudes Exhibit

Tonight is the opening reception for L(a)titudes - a multimedia exhibit at the Washington DC Jewish Community Center where artists "explore mapping borders and boundaries of Israel and Palestine". Among the artists featured is MOTW fan favorite Nikolas Schiller who made this map quilt from a CIA map of Israel - the image on the right is zoomed in.


Unfortunately the JCC web site does not provide much information about the artists so I had to do some digging to find other materials such as the map below from Karey Kessler. I guess you just have to go to find out more. The exhibit will be open until June 2nd so if you're in the neighborhood it's probably worth a visit.

Thursday, December 27, 2007

Map of the Week #105-A Geography of Chaos

We interrupt this season of peace and good cheer to bring you a map of the current turmoil in the Middle East. This map was done by Philippe Rekacewicz who does some nice cartography for Le Monde Diplomatique. The map is a companion piece to their November, 2007 "Special Dossier on the New 'Broader' Middle East" I had some more optimistic ideas but after today's events in Pakistan this one somehow seemed appropriate.

Thursday, December 14, 2006

MOTW #56

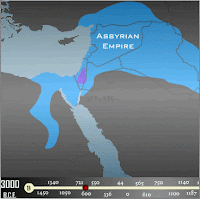
This is an animation showing the history of empires in the Middle East with a corresponding time line.