Wednesday, March 29, 2023

The Grand Paris Express

I was recently in Harvard University's Graduate School of Design (GSD) when I came across this fantastic exhibit on the Grand Paris Express. The GPE is a hugely ambitious project to add several metro ring lines connecting the suburbs of Paris to each other and to the central city. It will be 90% underground and consist of 200 km of new rail lines and 68 new stations.

Map via STM

Construction began in 2016 and is planned to be completed by 2030. The new lines are shown in white on this image from the exhibit.

The project won the GSD's Veronica Rudge Green Prize in Urban Design. "The overarching goal of GPE is to challenge the current monocentric model of Paris and create an open-ended megalopolis by radically changing existing patterns of circulation and decentering Paris itself." The project's ambitions go well beyond simply building 68 new stations. There has also been a huge effort to design these stations to be artistic, consider the flow and mood of spaces as you move from the street down towards the train platforms and to reflect the localities of each station. Here is a 3D model of the Noisy-Champs station.

Here is part of a "landscape strategy" map showing the types of terrain the new stations will be located underneath.

This map of "Sensoriality" is difficult to understand.

Even after figuring out the French, the legend is still almost impossible decipher,


and even more difficult to pick up from the map detail.

This map shows how the lines will serve the lower income (lighter colored) areas,

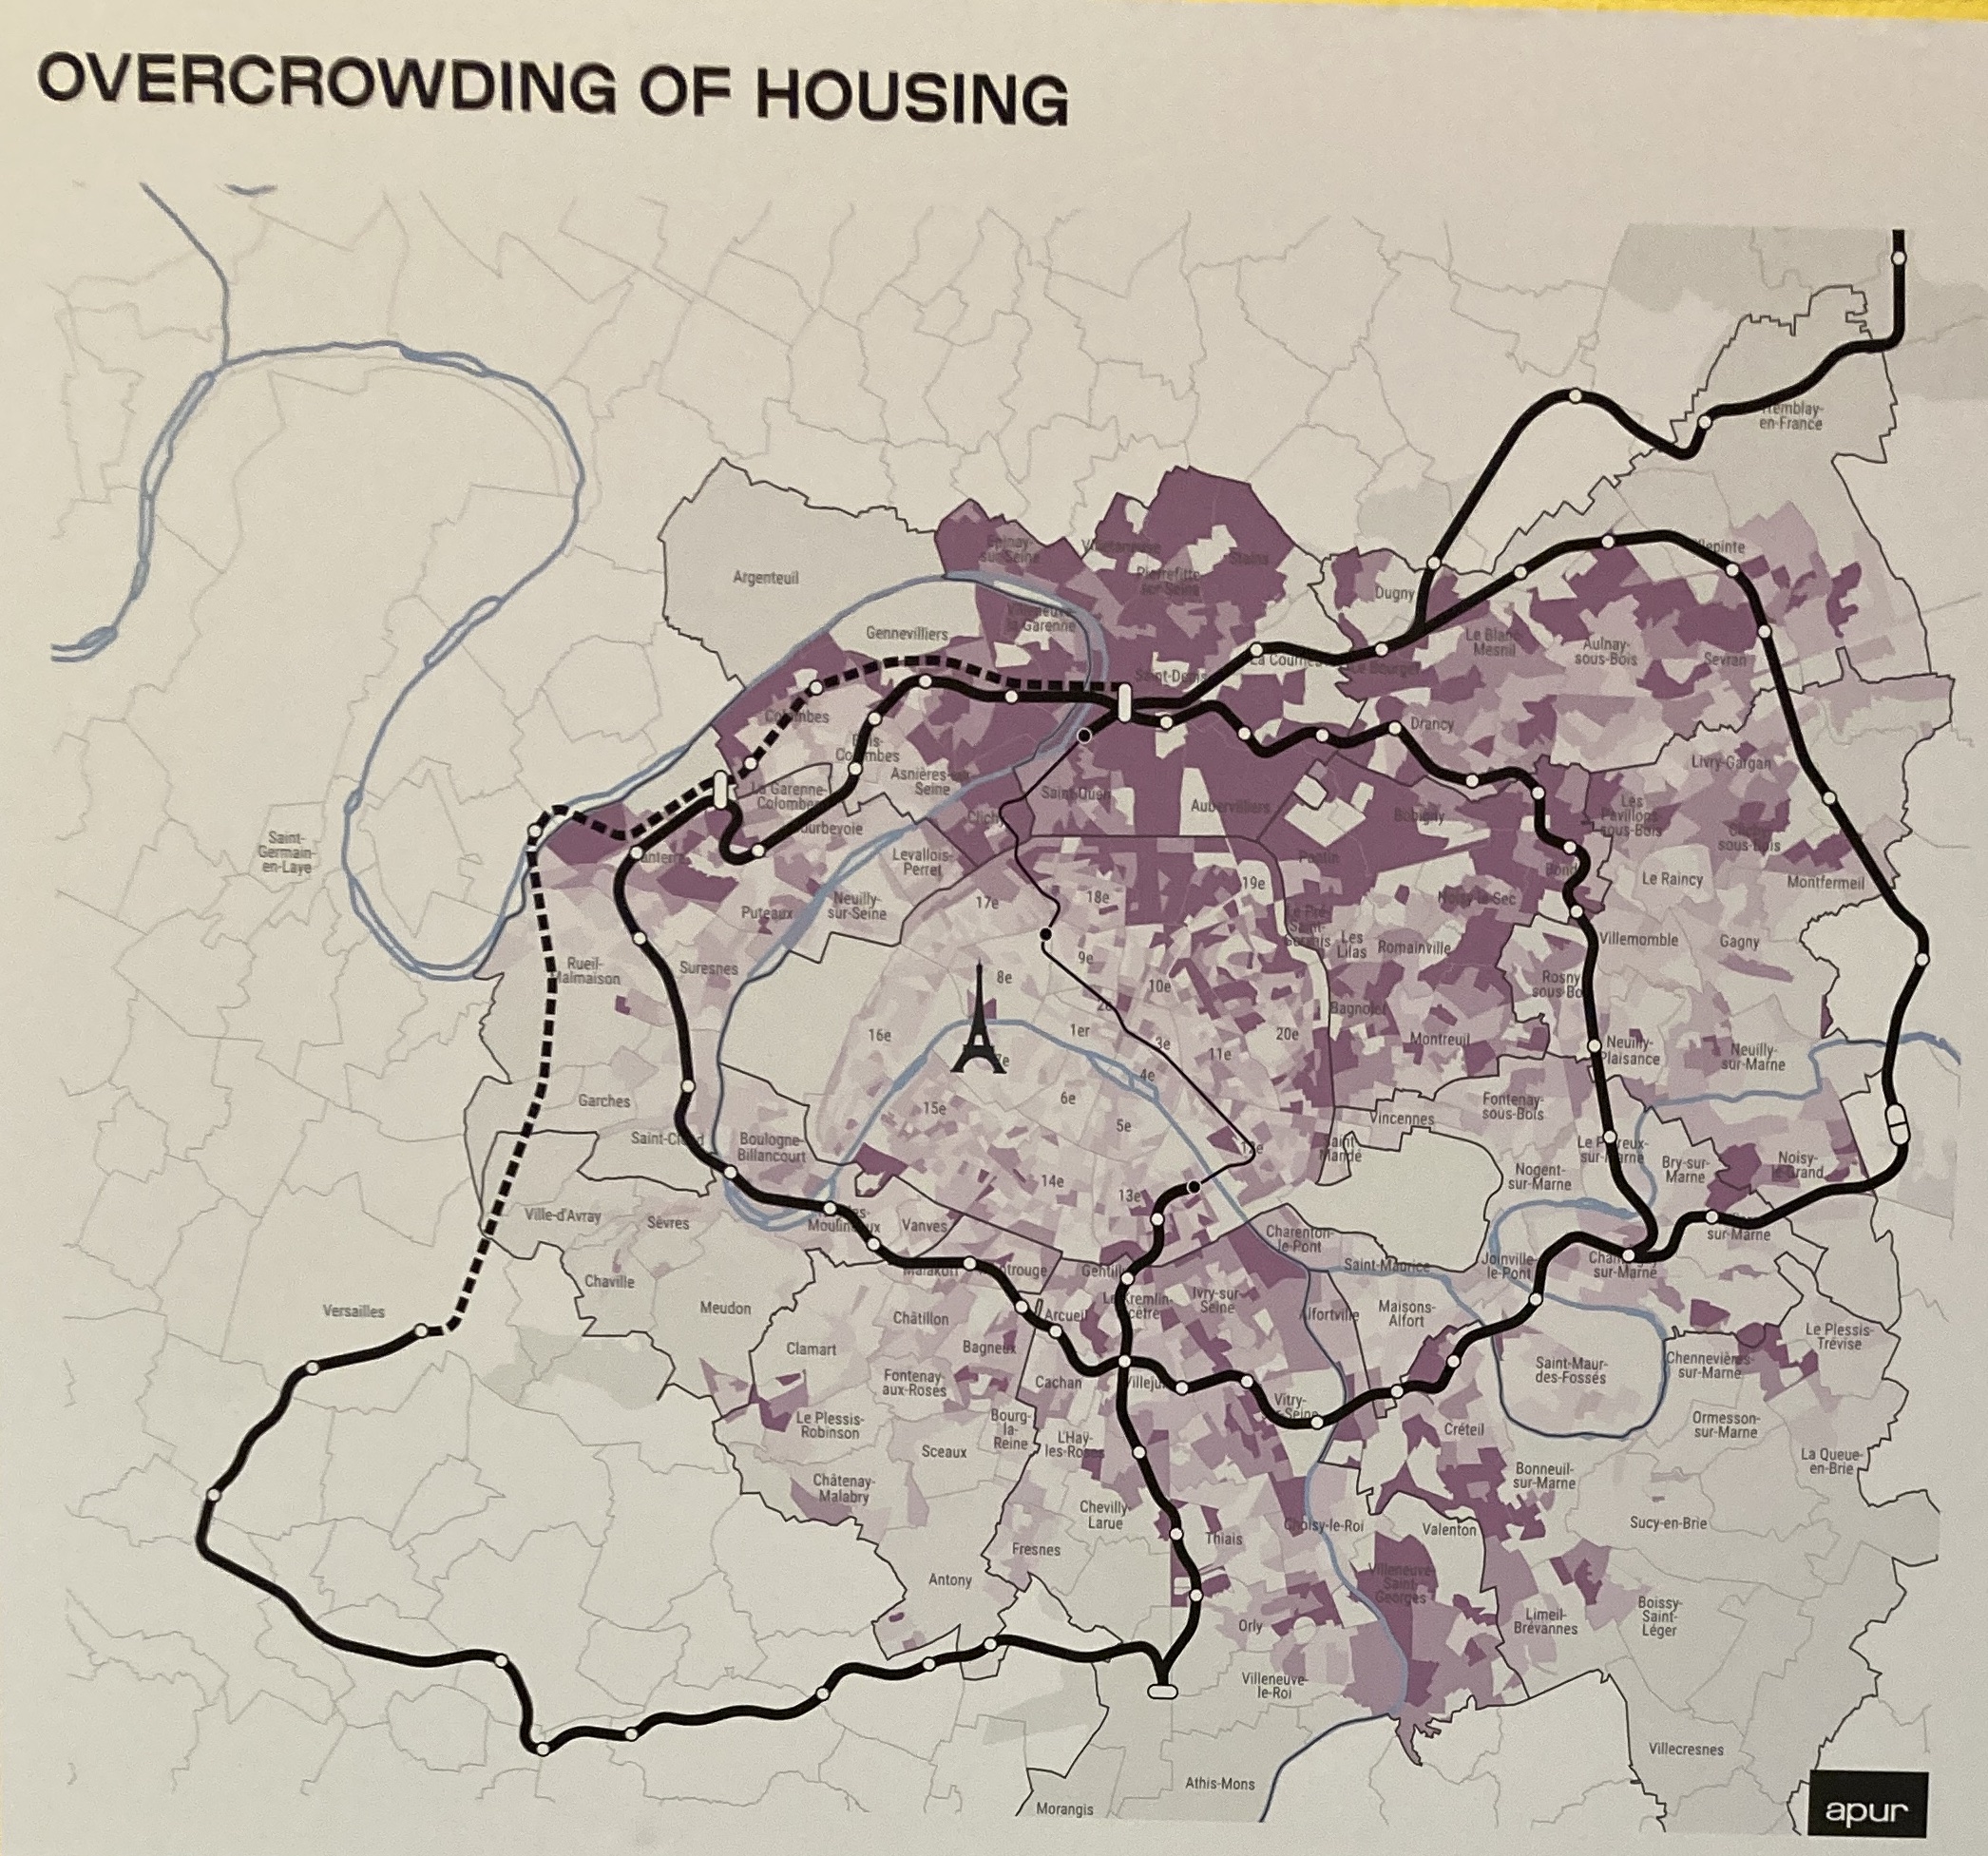
and another one shows areas where housing is overcrowded.

The increase in access to jobs is shown here. I left off the legend for formatting purposes but the darkest circles will have a more than 150% increase in access by 2030.

Here is one showing "urban momentum" highlighting housing construction projects that the project has spawned. The blue buildings are the larger projects.

Finally from the exhibit, a maps showing new areas (darker lines) that will be walking distance to a metro station.

The graph in the lower right corner is a bit hard to decipher from my poor photography but it tells an interesting story of transportation. Basically, pink is walking, yellow is various forms of transit starting with the horse and green are cars. The time period runs from about 1810 to 1930 and you can see the rapid rise and predicted decline in car use in favor of transit, bicycling and various other forms of mobility.

 One major issue, only briefly addressed by this exhibit is that Paris will be hosting the Olympics next summer. I think the plan is to have the parts of lines 15, 16 and 17 that serve the stadium and Olympic Village finished in time. Here's a map of Line 16 from the GPE web page.

Unfortunately this exhibit ends March 31st so if you want to see it live hurry up. Hopefully they keep the online exhibit up for a while.


Wednesday, March 22, 2023

Buffalo in 50 Maps

New from Belt Publishing - the third book of their "50 Maps" series, Buffalo in 50 Maps is now out. Previous books on Cleveland and Detroit have been briefly covered on previous blog posts. The author, cartographer Victoria Johnson-Dahl was kind enough to send me an advance copy that I can mine for some inside looks. Here's a map of the age of housing.

The city follows a typical pattern of expansion out from the center with the newest housing (in red) being infill development after the city was completely built out by the mid-late 20th Century. The city also has a history of segregation and building expressways through minority neighborhoods to help suburban commuters get downtown. The disparities between the mostly black east side of the city and other areas is clear on many maps including this one showing access to supermarkets.

There are some large food deserts on the east side where residents have to travel up to 2 miles to get to a full service grocery store. This map includes the store on Jefferson Avenue that only recently re-opened after a racially motivated mass shooting took place there. In addition to the horrors that area experienced they also had to deal with the inconvenience of losing one of the only two supermarkets on the entire central east side.

On a lighter note there are various maps showing local quirks. Here is where you can smell Cheerios being toasted at the General Mills plant on Kelly Island.

This map shows where the fruit trees (in red) are found in the Fruit Belt neighborhood.

Finally here is a detail from one of my favorites-a map of invasive species, including an alligator named Scajaquada Jack, named for the creek where he was found. He was captured after several days, fed some chicken wings and sent down to Florida.

If you want more details about where people drive cars into buildings, where you can see fiberglass bison and how long it takes to get to a Bills game then this is the only book you'll ever need.  You can buy it  here. If you're in Buffalo on Friday you must can attend a panel and book signing.


Wednesday, March 15, 2023

Maps GPT

I've been seeing a few interesting uses for ChatGPT-type artificial intelligence lately. Of course there has to be a map generator. MapsGPT is powered by Proxi, an alternative to Google's MyMaps. I started out looking at their map suggestions, such as worst places to take a nap near Seattle,

or loudest college football stadiums "near usa"

Next, I tried my own map. You pick a subject and a place - it's always listed as "near" hence the awkward "near usa" from the above example. After a few unimpressive efforts, I tried a goofy one - places to see dolphins near Kansas. Guess what - there are a few!

In addition to the one above there is also SEA LIFE Kansas City with "the most knowledgeable dolphins in town".

I'm pretty unfamiliar with Proxi so I tried to create a few things on that platform with some uneven results but it looks like you can style the map so they don't all have the same look and change the icons so they're not all teardrops. I plan to play with it some more and if I get anything worth sharing I will.


Wednesday, March 8, 2023

Map Failbruary Challenge Days 15-28

Here is the second half of the #MapFailbruaryChallenge. For the first half and explanations see here. Here are the categories, again with minimal commentary.


Day 15 - You do not need to know geography to be a cartographer

Day 16 - Not safe for work

Day 17 - Not enough or too much text

Day 18 - Make a country look like its flag classification map - a popular and very hard to read genre on the internet.

Day 19 - that really should have been like 3 different maps

Day 20 - Irrelevant variables

Day 21 - worst hand drawn map

Day 22 - could have been a bar chart. I tried to make an actual bar chart out of goofily deformed Italys. The categories (ie. breads, cereals and pastas) were reduced into simplistic cliches for fun.

Day 23 - worst font

Day 24 - shocking correlations. Turns out your toilet had jets that flush in a designed direction independently of where you are but your sink...

Day 25 - The map with the highest number of hardly detectable errors

Day 26 - worst hiking map

Day 27 - worst decorations

Day 28 - worst abuse of digital elevation model (DEM). I had a DEM of the Puget Sound area that I flattened a bit, messed with the colors and made it look like an oil slick.


Thursday, March 2, 2023

MapFailbruary Challenge Days 1-14

Those of you who follow me on my Twitter and Mastodon feeds know that I spent February doing yet another map challenge. Like November’s 30 Day Map Challenge, only this one encourages you to fail. The #mapfail hashtag is popular and somewhat contentious among cartographers. Today’s software allows any untrained person to make a map and some of them are quite bad, though some of the #mapfail’s that get called out are a bit unnecessarily snobbish. Anyway, here are the daily mapfail prompts and the official challenge page is here.

Failing can be harder than it looks but this has been a lot of fun. I will post my entries with minimal commentary-a few maps will need some explaining though.

Day 1 - clearly made in non-mapping software

Day 2 - in a hurry

Day 3 - my cartography teacher had a checklist and this one checks them all

Day 4 - source: “trust me bro”. I used this source several more times. I made this data up quickly without a lot of thought.

Day 5 - egregious and unforgivable omissions.

I have nothing against France, in fact I’m quite fond of the place but I did want to see what the world would look like without it.


Day 6 - worst sarcastic map

Day 7 - bad point symbols

Day 8 - rainbow is the new black. Rainbow color schemes are appealing but they do a terrible job conveying values along a color scale (ie. what is darker, lighter). There is a use for them though, they’re fine for weather maps. Pennsylvania is known for its “ridge and valley” topography. I made up a fake term “ridgyness” to show it. It would have been more rainbow like if I had extended the red all the way across the state though.

Day 9 - worst 3D map

Day 10 - worst colors. I saved a little time by using the same data from Day 8,.

Day 11 - horrible use of choropleth. Choropleth refers to maps showing areas (or points) shaded or colored by some value (ie population density, voting results, etc). A couple people pointed out to me that in South Korea babies are considered to be 1 at birth so the map is wrong!

Day 12 - worst title. Based on a map of the most “populous” countries. Popular is a meaninglessly subjective title. Also there’s a typo in the title that I left for effect.

Day 13 - not colorblind friendly. The most common form (and it’s common!) of color deficiency is difficulty in distinguishing red from green.

Day 14 - worst Valentine’s Day Map.