Thursday, May 30, 2019

Japanese Control of Aboriginals in Taiwan

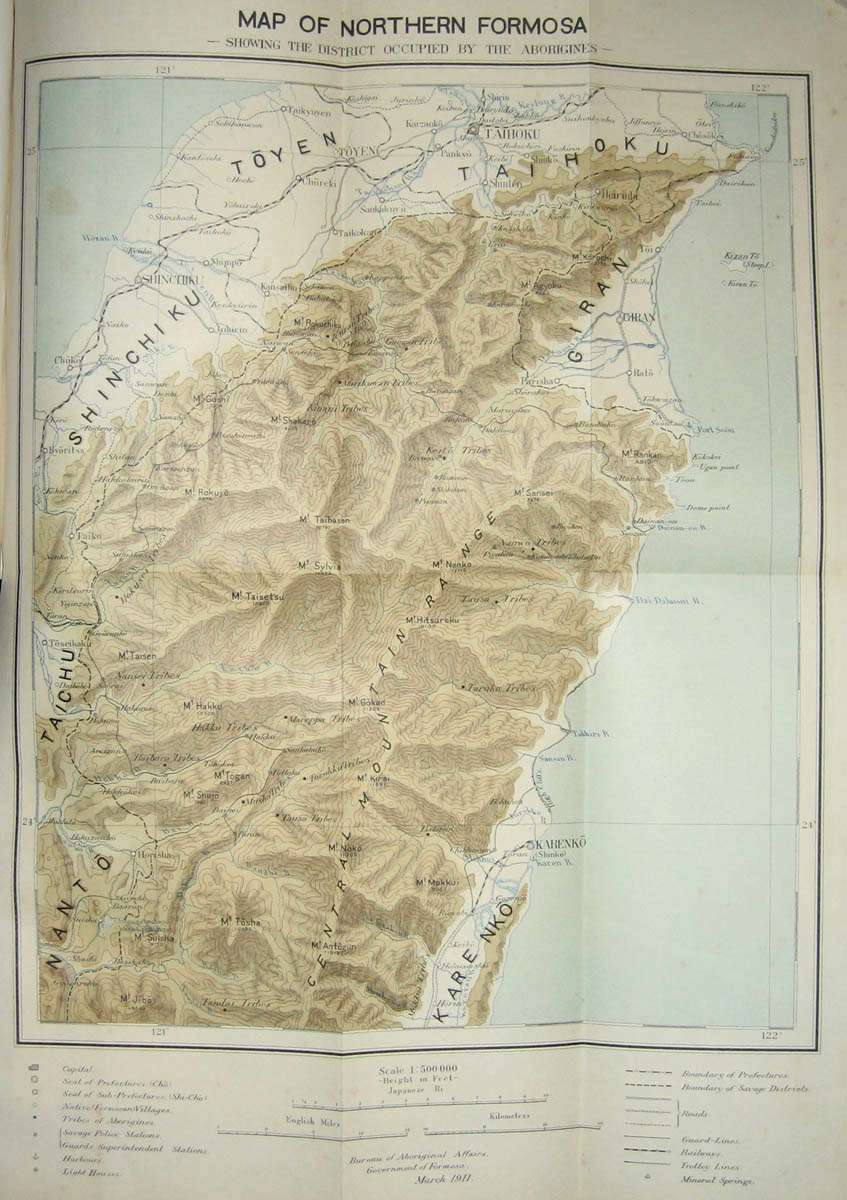
This map from the 1911 Government of Formosa Report on the Control of the Aborigines in Formosa shows the location of aboriginal tribes using vivid colors and language.
http://baxleystamps.com/litho/meiji/formosa_1911_rpt_map1-1.jpg
Japan took control of Formosa (Taiwan) in 1895 as a result of the First Sino-Japanese War. The Japanese were in a state of frequent conflict with the aboriginal people of the mountainous east, referred to as "savages" in the text as well as in the legend of the map. The map also shows "guard lines" - outposts manned by trusted indigenous troops under Japanese authority. 

The book details the customs of these people with extensive photographs. There were approximately 100,000 natives living in 671 villages.  It also includes two detailed topographic maps of eastern Formosa. Here is part of the northern map - click to see the entire map.
http://baxleystamps.com/litho/meiji/formosa_1911_rpt_map2-1.jpg
Japan held control of Taiwan up until the end of World War II, its resources and people contibuted greatly (though mostly not willingly) to Japan's rise as a global power.
 

Wednesday, May 22, 2019

Mammoth Cave

Map of the Mammoth Cave: Accompanied with Notes - via Library of Congress
https://www.loc.gov/resource/g3952m.ct001823
This is a remarkable map from 1835 (Doolittle & Munson, Cincinnati) showing the geographic view alongside diagrams of each section or "room". 
Different colors are used to differentiate the sections to help unify the section drawings with the map.
Here is the area under Mr. Gatewood's House, near the cave's mouth,
and the view from below.
The map includes a view of the mouth of the cave above the title block.
Here is the mouth on the map.


Thursday, May 16, 2019

Goldfield

Goldfield, Nevada was a boom town. Gold was discovered there in 1902 and within a few years it became Nevada's largest town with about 20,000 people. As of the 2010 Census the population is now down to 268 - via Wikipedia. This map, on display at the La Jolla Map & Atlas Museum, does a good job of conveying the chaos of the time.
Map courtesy of the La Jolla Map & Atlas Museum
Here is a close-up showing some of the competing land claims.
Companies came from near and far to set up shop - including ones from Baltimore, Chicago, Utica and Tonopah. A directory of all the companies is so large it takes up both sides of the map.
Here is the downtown with its grid pattern.
The 1907 directory lists "Saloons 49, Restaurants 27, Barber Shops 15, Bakeries 6, Assayers 54, Attorneys 84 (try finding one of those around here today). Brokers 162, Cigar Stores 14, Grocers 21. Hotels 22, Laundries 17. Doctors 40 (another hard group to come by), Undertakers 10 (they’d be the last ones to let you down)." - via Goldfield Historical Society. There was also plenty of labor unrest.

The U.S. Geological Survey "Goldfield Special Map" from 1908 also conveys a sense of chaos.
From the Perry-Castaneda Library - University of Texas
A 1907 railroad map of Nevada details the new routes through Goldfield.
http://legacy.lib.utexas.edu/maps/topo/nevada/txu-pclmaps-topo-nv-goldfield-1908.jpg

By 1910 the population had already declined because the high cost of pumping out brine was making mining less economically feasible. A flood in 1913 and fires in 1923 and 1924 sealed the town's fate as a (partial) ghost town. 

Today Goldfield contains a handful of streets and businesses. Google Maps gives a sense of the town's layout, including some empty streets as well as attractions including the International Car Forest,
and the Historic Cemetery.


Wednesday, May 8, 2019

The Awakening

The Awakening, a cartoon by Henry Mayer about women's suffrage was published in 1915 in Puck Magazine. It shows liberty marching across the nation from the west to the east.
https://en.wikipedia.org/wiki/Puck_(magazine)#/media/File:Henry_Mayer,_The_Awakening,_1915_Cornell_CUL_PJM_1176_01_-_Restoration.jpg
The western states (in white) had all granted women the vote, while the rest of the country was "in the dark" waiting for the march of freedom, which finally came in 1919 with the 19th Amendment to the Constitution. Although New Jersey briefly allowed women the right to vote shortly after the founding of the country, it was the west where the right to vote was first permanently established. Wyoming was the first state to pass a law explicitly giving women the right to vote in 1869. Utah, Idaho and Colorado followed and by 1915 there was a clear geographical pattern.
https://en.wikipedia.org/wiki/Nineteenth_Amendment_to_the_United_States_Constitution#/media/File:Map_of_US_Suffrage,_1920.svg
The map above shows the state of women's suffrage laws just before adoption of the Amendment. The color scheme is complicated but dark blue is full suffrage and then the colors go through various levels of partial suffrage until red, which is no suffrage. The legend can be seen by clicking the image above.

The 19th Amendment passed the House of Representatives in May, 1919 and the Senate the following month. By August, 1920 enough states had ratified it to add it to the Constitution, however some  southern states did not ratify it for decades afterwards. Mississippi was the last state to ratify it - in 1984.

Thursday, May 2, 2019

Sinking Miami

I recently watched the PBS documentary Sinking Cities: Miami. One thing that jumped out at me was this map. I could not find this version (from about 1835) online but here is a screen shot from about 20:45 in.
Basically the entire Miami area, except for a few spots along the coast, and the rest of soutrhern Florida was part of the Everglades swamp. Here is an 1856 version of the same map - via the Florida Center for Instructional Technology.
http://fcit.usf.edu/florida/maps/pages/3700/f3793/f3793.htm
The map can be browsed at the Newberry Library. Here is the Miami area (Fort Dallas) - a few uplands (listed as the Koontee and Hunting Grounds) surrounded by swamp.
By draining large parts of the Everglades, the city's developers have been able to create vast tracts of habitable and desirable land in these former swamps. However, sea level rise is starting to create problems from nuisance flooding (even on sunny days high tides can push up the ground water and cause flooding) to large scale storm destruction. This map, from National Geographic via Catalyst Miami shows areas that would be under water at high tide with a 5 foot sea level rise* and flood prone urban areas (in darker blue).
https://catalystmiami.org/climate-resilience-local-engagement/

Here is a more readable close up of the Miami area.

One result of the recent increase in flooding has been climate gentrification. People are buying houses in formerly poor areas such as Little Haiti, away from the water that are on higher ground. The wealthiest can afford to engineer adaptations to rising sea levels but others are at a high risk of their homes becoming uninhabitable. These people can't as readily move and even if they could there are few affordable options for them.

This map via The New Tropic shows the Little Haiti area annotated with elevations above sea level. The heart of Little Haiti is between NE 2nd Ave and NW 2nd Ave. The author tries to determine how much gentrification is climate related but with many other factors involved ultimately is not able to draw a conclusion. However, the map does show why these areas would be desirable to those moving from further east (or even west where elevations are also lower).
* predictions for sea level rise range from about 1 to 3 feet by 2100 - more here.