Showing posts with label washington DC. Show all posts

Thursday, April 20, 2023

Parking Lot Map

 The Parking Lot Map is a project of the Parking Reform Project, an organization dedicated to climate action, safer streets and housing affordability. The map explores how much land in the central area of the major cities of the United States is dedicated to parking. On average 20% of land is dedicated to parking (this does not include the land dedicated to streets and highways). In Columbus that number is 27%.

The map interface is simple and effective-red parking lots on a gray background. There is a pick list where you can choose a city. Some cities have a "view more" button where you can get zoning details. Here is a map of the Columbus Parking Overlay District.

At the bottom is a graph ranking the cities.

The bottom entry is Arlington, Texas with 42% of its downtown dedicated to parking. The lowest non-suburban city is Las Vegas with 32% of its land as parking. 

Some people would argue that a parkable downtown is a good thing and the cities at the bottom should be considered the best places but charming old European cities like Paris aren't universally loved for their ease of parking. 

The best cities on the list tend to be older ones built out before cars. Washington D.C. only dedicates 3% of its downtown area to parking.

However there are plenty of exceptions. Detroit, the motor city, dedicated 30% of its downtown to parking.


Wednesday, November 10, 2021

Thirty Day Map Challenge - Part 1

 Several years ago Finnish cartographer Topi Tjukanov began the Thirty Day Map Challenge and it has run every November since. The idea is to create a map every day of November based on a theme he posts at the start. These maps are posted to Twitter using the hashtag #30DayMapChallenge. There have been some wonderfully inspiring maps created in this process. I had never participated before this year, correctly assuming it would take up a major part of my time and energy. 

As in other years, I had no plans to do this but on November 1st I suddenly found myself making a map and it took off from there. At the risk of being a self-indulgent show off here are the first 10 maps. As of right now I don't have an online portfolio so here is a place for me to post them. I'm hoping to continue on this challenge but time will tell if I make it to the 30-day mark.

Day 1 - Theme: Points

I'd been working on a general "where I've been" map and I got to thinking about places I've spent the night. I looked at a few states that either didn't seem interesting or had too many uncertainties when I settled on Ohio. I've been working on my weak artistic skills. This was drawn in watercolor pencils by hand while looking at a map of the state.

Day 2 - Theme: Lines


 I don't really like the song "Every Day is a Winding Road" by Sheryl Crow, but somehow it got stuck in my mind and I set out prove it. I used various mapping services such as Google, Bing, Apple and OpenStreetMap to illustrate examples of streets around the world named for the days of the week. One of the tricky parts was finding streets that are in fact "winding."

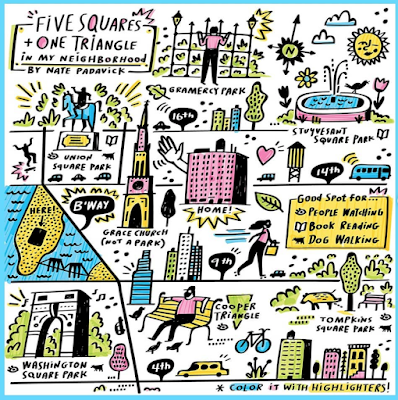
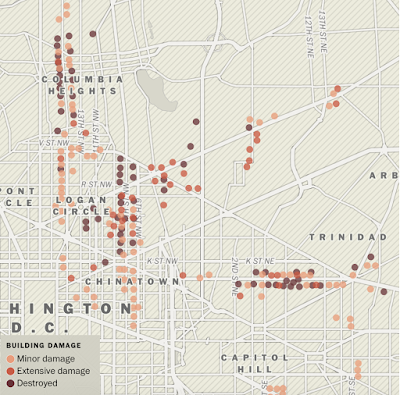
Day 3 - Theme: Polygons

Points, lines and polygons are the main building blocks of maps so each one gets a day. DC seemed like a good polygon city. I used Opendata DC to get my points. I removed some tiny triangles and it's possible I missed a few circles and squares. There are many rectangular parks that I didn't include because they don't have "square" in their name. I almost forgot about the Ellipse! 

This was a mixed media project. I made and printed a map using QGIS annotated it with pencils and put a little watercolor into the rivers.

Day 4 - Theme: Hexagons


Hexagons are a popular way to represent grids these days. Studies show that certain patterns are easier to detect with a hexagon grid than a square grid. They are particularly popular with election maps but I was looking to do something a little more creative. Not many things in nature are hexagonal. Bee hives use that shape but that kind of map has been done by many others.  While looking for inspiration, I discovered that some of Annie's Snack Crackers are hex shaped, including their saltines and cheddar crackers. I decided to use them as my hexagons.

    So where is a place that has both salt and cheese production? I settled on upstate New York, knowing where some of these places are located. The salt areas are mostly based on an old map I found showing salt deposits, mostly in the southwest. I also know of a couple of salt facilities from my travels so I put those in. I used the term "more likely" to cover the uncertainties but some of those hexagons in the southwest should probably be cheese. The cheese areas were determined by a combination of dairy farm maps and places I know that make cheese.

Day 5 - Theme: Data Challenge 1: OpenStreetMap


For the uninitiated, OpenStreetMap (OSM) is like Wikipedia meets Google Maps. Content is all user generated and it is freely available to use. Despite having contributed to OSM in the past, I don't have a lot of experience using the data so this was definitely a learning exercise. I knew that you can get things like businesses out of it so I tried a query on business names. For some reason, the first word that came to me was "monkey" so I grabbed all businesses with monkey in the name. After seeing an empty South America, I decided to add Spanish and then to make it a bit more objective I grabbed the other three of the world's top languages. In the process this became as much of a linguistic map as anything. 

There are many translation issues here. French and Spanish have different masculine and feminine words and the Spanish words (mona, mono) are contained within many other words and names. My Hindi translation must have been especially off since all my results came from outside of India. Anyway I did what I could here.

Day 6 - Theme: Red

Getting personal here. This is a map of the town where I was born. I was nervously waiting my turn to perform some music on Zoom and parlayed that energy into drawing. Like #1 I tried this completely freehand, while looking at Apple Maps. I've only been through Red Bank as an adult on a train so I don't know the place at all. Someday I hope to visit. The river west of downtown is very wrong and there are other mistakes. Also the map monster and train station were poorly done.

Day 7 - Theme: Green 

Staying in the realm of the personal, Rittenhouse Square is around the corner from my grandmother's former building. As a child I enjoyed playing here, especially with the goat statue. I also lived in the area briefly as an adult. I'd been thinking about how the same places look in different map services so I made an animation of the square using Apple, Google, Bing, Mapbox, Carto, Esri, Stamen, Mapquest, OSM and the philly.gov web site.

Day 8 - Theme: Blue

I started out trying to get a list of blueberry names using the Day 5 OSM theme but the results were not great. Next, I tried using the Google Maps API but also had issues with that. Finally, I found an embedded Google Map from travel-mi.com. I wasn't planning on a Michigan focus but because the data set was there I went with it. I already had a blueberry symbol from my What They Drop on New Years Eve map so I was good to go!

Day 9 - Theme: Monochrome

I thought one of those solar potential maps would look good in monochrome but I'm not sure it works. I also thought that light should be more sun but usually darker means more so this ends up being a bit counterintuitive. I also was not really able to get the subtle gradations of grays with a watercolor pencil. I probably should have tried charcoal instead. I don't trust my drawing abilities to do a complicated outline like this freehand. I traced it right off the computer screen. The rest was done freehand, making it "charmingly inaccurate". 
 

Day 10 - Theme: Raster

I made a very low resolution version of a satellite image of Australia. Then I made a fuzzy version. I couldn't decide which I liked better so I made an animation: blocky vs fuzzy


Though this challenge has taken up way too much of my time and thinking process, it has also been a creative inspiration and a great learning experience so far. I'm looking forward to some of the upcoming challenges with a touch of dread but also excited to take them on.

Wednesday, July 1, 2020

Sea Level Rise-Coming to a City Near You

Conspiracy of Cartographers has a series of maps showing what will be underwater in various cities after 215 feet (66 meters) of sea level rise. Keep in mind that this is "end point" sea level rise and not anything we would see in our lifetimes. A recent page highlights new maps of Philadelphia,
https://conspiracyofcartographers.com/2019/10/12/philadelphia-sea-rise-map/
and Washington, DC.
https://conspiracyofcartographers.com/2019/10/12/washington-dc-sea-rise-map/
Both maps show similar patterns with the central cities completely flooded and the land being mostly peninsulas in the hilly north and western suburbs. There are also some nice puns.
In Philadelphia, Hunting Park becomes Fishing Park, University City becomes Irreversibly Pity, Wayne Junction, Drain Junction, and Northern Liberties is now Northern Fisheries.

Other maps have been done for cities in the U.S., Australia and England as well as a few larger regions. Here are Cascadia,
 The Palm Springs-Coachella area of California,
an almost completely waterlogged Brisbane,
and Los Angeles, featuring one of my favorite puns- the Ex-LAX airport.


Wednesday, April 29, 2020

Mapping Your Neighborhood Under Lockdown

Bloomberg Company's CityLab and the New York Times have both asked readers to submit maps of their neighborhoods under lockdown. The Times one, via Instagram includes this map from Nate Padavick,
https://www.instagram.com/p/B_clPHJA__o/
and some directions on how to make it.

Here are some reader submissions that I like.

Three ways to the creek in Austin, Texas by Champ Turner
https://cdn.theatlantic.com/assets/media/img/posts/2020/04/Champ_Turner_Row_174/98f2ea959.jpg
Birding the Pandemic by Rick Bohannon of Minnesota.
https://cdn.theatlantic.com/assets/media/img/posts/2020/04/Screen_Shot_2020_04_17_at_4.23.58_PM/90b0eeffa.png
Santa Cruz de la Sierra, Bolivia is known as the City of rings for its network of Ring Roads. Augusto Javier León Peralta's shows his neighborhood "ring" incuding the route from home to the market and back. "We can even see some animals in the city that were not seen before"
https://cdn.theatlantic.com/assets/media/img/posts/2020/04/Screen_Shot_2020_04_24_at_10.52.06_AM/f0a6b3aff.png
Here is one from Calais via Twitter
A map from Lauren Nelson of Arlington, Virginia showing the "moat" that the Potomac River has become.
https://cdn.theatlantic.com/assets/media/img/posts/2020/04/Lauren_Nelson_Row_81/4f5455341.jpg

Finally, one from the NY Times Travel Instagram- a nice, simple pen & ink from Emily Bouchard in Chicago.
https://www.instagram.com/p/B_iDBDOliuj/
For more from instagram click here, but you need to wade through a bunch of stupid, gorgeous photos to find the maps. For the more maps go to CityLab

Wednesday, April 4, 2018

The Riots in Washington DC

Fifty years ago, on April 4th, 1968, after the assassination of Dr. Martin Luther King Jr., Washington D. C. erupted with several days of rioting. The Washington Post has an excellent story with pictures videos and maps. Here is an animated map showing incidents as reported by the Secret Service.
This map shows the overall amount of destruction. I altered the original image slightly to show the legend.
https://www.washingtonpost.com/graphics/2018/local/dc-riots-1968/?utm_term=.f1da7e1f8f1e
Here are the two maps above overlaid.
There are also a few detailed maps of the major corridors where destruction took place showing individual buildings using the same color code. This one shows 7th St NW.
Here is a tweet from Lauren Tierney, Graphics Reporter at the Post about the design process. The color scheme replicates the original map.
Also, one for the north arrow.

Wednesday, February 14, 2018

Look North

Going through my recently acquired road maps, I was intrigued by the many different north arrows. Many are gas stations maps-the work contracted out to map publishing companies such as Rand McNally and H.M. Gousha. Oil companies put their names on the map and often their logo on the north arrow.
Here's an example from the Gulf "Richmond Tourgide" - their cutesy misspelling, not mine. Rand McNally produced this map. Here are some more:


Flying A Service Metro D.C. Street Map- Gousha.


Cities Service - I don't know who they were and it was hard to get a clear picture of their logo. This is from their Maine map (Bangor inset). You can see the H. M. G. Co. (Gousha) text.


Before Arco, there was Atlantic - From a Tampa-St Petersburg map-Rand McNally


American - Greater Miami Street Map and Mobil Travel Map of the San Fernando Valley, California - Rand McNally


Two Gousha's - one from the Hertz/American Express Chicago map and one from their own branded New Orleans city map.


AAA's maps used this globe north arrow. They liked to put them in the water.


Here is one from Rand McNally's Los Angeles map. It appears on the LAX airport inset. This map looks very different stylistically from the rest of the map and the Thomas Brothers north arrow explains why.

The other sections of the map all have this dull, understated e.e. cummings- style "n"


Some state tourist agencies.
Maryland - I don't love Maryland's schizophrenic flag, but I like how they incorporated it into their north arrow.


Virginia - very detailed.


Montana-now that's a quality north arrow!


Best of all - South Dakota with its compass ring showing where the needle would point at the center of the state. Two rings, one for true distance and one for magnetic variation, plus the state seal!
 Here are some more