Showing posts with label mexico. Show all posts

Wednesday, January 7, 2026

Overlooked Mapping Highlights from 2025-Part 2

Here are some more mapping highlights from the last year:

 5. Silk World War II escape maps

This is from an episode of a podcast called What’s Your Map featuring former cartographic researcher in the UK Ministry of Defence Barbara Bond

Top secret British intelligence agency the MI9 produced a series of maps on silk (and later rayon) designed to help soldiers evade or escape from capture. This map is of Danzig (Gdansk), where the Vistula River enters the Baltic Sea.


Escapees used their knowledge of these areas to direct others to Swedish ships where they would be safe to escape to that neutral country. Maps were printed on fabrics such as silk, which could be stitched into clothing or kept in a pocket and did not make any noise when folding or unfolding them. The maps showed where coal is loaded onto Swedish ships, the arc of light to be avoided, ditches where people could hide and the network of railroad tracks that would need to be traversed. More on these maps and on Bond’s career can be heard on the podcast.

6.  Mapping the Wikipedia Rabbit Hole

WhereWiki allows the user to enter any Wikipedia page and see all of its hyperlinked connections in any given area. When I first saw this, the keyboard player for the Cure had just died so I chose the band’s page and the area around Crawley, UK* where they were formed.


A click on any point brings you to the referenced page. The green dots are locations and the blue are people or groups.


*You can choose the default area (where you are now) or just about any other place on earth and you will likely find plenty of geographic links to whatever page you chose. 

-via Maps Mania


7. Smell Map of the Minnesota State Fair

Jake Steinberg, a cartographer and journalist for the Minnesota Star Tribune created a map of the smells of the State Fair. You can see the full map and article here but you might hit their paywall


8. Inundation Map of the Town of Guadalupe (1819)

Guadalupe, now part of Mexico City suffered a major flood in 1819. The entire area was in the basin of former Lake Texcoco and floods were a frequent occurrence


-Maps via Pedro Zurita Zaragoza on that great mapping site known as LinkedIn.

The map shows inundated areas in aqua tones. Two waterfalls shown at the bottom are breaches of the Guadalupe River.


Text in the legend describes how canoes were needed in the plaza and a note at the bottom states that the floodwaters receded “by virtue of the wise measures of His Excellency (the viceroy), thus preventing its spread to the capital.” Plans to drain the area took almost a century after this to be implemented and this was largely responsible for drying the entire region.

9. 12 Foot Wool Map Needs a New Home

 A group of up to 18 women in County Wicklow began making a 12 x11 foot knitted and crocheted map of Ireland in 2019. 


As reported by The Journal (Ireland). Most of the project took place at Carnew Community Care, a centre for older people. Now that it is finished they are looking for a place where it can be publicly displayed. This was from July. I have not been able to find any follow up on whether they’ve found a location for it.


 -via The Map Room


Wednesday, December 3, 2025

30 Day Map Challenge 2025 - Days 26-30

Here lies the final installment of this year’s 30 Day Map Challenge. November was busy with the last 3 weekends out of town, a brief illness at the end and a new (dog) family member. I was not sure I would be able to finish and while I did this last batch of maps are ones that could use more work.

Day 26 - Transport

This unsatisfying map took several forms before arriving at its current state. The railroads, ports and airports came from the Natural Earth dataset that was the subject of Day 22. I tried just showing railroads with no other context but the result was dull. The most used shipping lanes were added from Marine Vessel Traffic. I wanted to represent them in a way that was clear, but also fuzzy enough to show the many variations of the routes. It’s interesting how the ship traffic largely bypasses Cuba. This map was revisited for Day 30 but without much more success.

Day 27 - Boundaries

Boundaries were drawn from Encyclopedia Brittanica. The flag idea was fun but ultimately does not add much. I’m not sure how those two areas of international waters came to be. They almost mimic the 200 mile exclusive economic zones but the distance is much further.

Day 28 - Black

A black theme for Black Friday. This was fun to make and came out nicely but after seeing what others posted for this theme, I may have been able to do something more interesting.

Day 29 - Raster

These last two days were particularly difficult as I was ill and also traveling. The Gulf of Mexico Dead Zone appears every summer when nutrient rich water, mainly from agriculture enters the Gulf depleting aquatic life of oxygen. The zone’s size varies from year to year but it is always large. The raster image was taken from NASA and only the land part was altered to make it stand out more.

Day 30 - Makeover


I almost didn't get this one done. In fact it really isn’t done. I had the idea to take the map from Day 26, and make it antique style like my Day 24 Portolan Chart map (from this post). I removed airports and thinned out the railroads. Unfortunately it looks too much like the portolan chart map. Time constraints left me unable to improve it.

Well, it’s been fun and I’ve learned at least a few things about the Gulf of Mexico and maybe you did too. Thanks for tuning in to my obsessive compulsions for a full month. Ultimately my tiny protest against the weak “obey in advance” stance of most map companies will be meaningless but it felt good to get it out there. I will never use that other stupid name, if I can help it. Maybe others will join me in that at least.

How does Gulf of Cuba sound? Not great either.

Wednesday, March 27, 2024

Tacografical Maps

International Taco Day is coming up on Sunday, March 31st - not to be confused with National Taco Day in October. Here are a few maps to enjoy your tacos by. This one I've seen in several taquerias. It took a long time to find a version that is readable online (you may need to click on it to see it at a readable scale) but I finally Reddit came through for me.

 Expedia Mexico has another take on Tacography.

Here yet another Tacographic map found on Pinterest Japan.

Finally there is the Tacopedia, an encyclopedia of Mexican taco culture.


Wednesday, June 21, 2023

The Southern Underground Railroad

This map, via Smithsonian, shows the main passageways that the enslaved took southwards to freedom.

The southern Underground Railroad was less traveled and much less well documented, but Mexico after gaining independence passed strong anti-slavery laws. Even before that the Spanish government granted freedom to many who escaped to the south. When the United States passed the Fugitive Slave Act in 1850, Mexico refused to comply despite pressure from US diplomats. When Mexico lost Texas and large portions of other states to the United States as a result of the Mexican-American War, slavery was re-established in Texas and the Rio Grande became the crossing to freedom. - via Smithsonian


Wednesday, March 30, 2022

Women's Suffrage in 1917

As a follow up to Women's Suffrage in 1908, here is an ad from 1917 showing how suffrage (the white areas*) had expanded through most of Canada and parts of the United States. 

The ad is from the National Women's Suffrage Publishing Company and asks how long the U.S. will lag behind Canada. For contrast here is the 1908 map again. Keep in mind that the color scheme is reversed.


*yes the white areas are actually sepia areas, OK.

Friday, November 19, 2021

Thirty Day Map Challenge - Part 2

Here are the next batch of maps I've posted for the #30DayMapChallenge. The first ten maps are here.

Day 11 - Theme: 3D

For the 3D theme I attempted to recreate an exercise from my first cartography class back in the 1980's. That exercise was done using a pencil and graph paper. Unfortunately, I do not have my notes or remember the exact procedure. I did this one using GIS software instead. The map shows murder rates by state. Back then North Carolina was #1, now it's Louisiana. The map is "upside down" so that the higher southern states don't block the view of the lower northern states.

Day 12 - Theme: Population

This is a map of Arctic settlements done "firefly" style, which is fashionable these days in cartography circles.

Day 13 - Theme: Data Challenge 2: Natural Earth

Natural Earth is a set of publicly available data. It is a collaboration involving many volunteer NACIS members and cartographers around the globe. Nathaniel Vaughn Kelso and Tom Patterson led the effort. They have produced some beautiful topographic images of the world. The map was also inspired by a NACIS talk on indigenous place names. The topography and streams are from Natural Earth, while the place names came from Canada's Open Data site.

Day 14 - Theme: Map with a new tool

This one is a bit of a mess because I started doing a tutorial using R, a new tool for me, but I ran into some technical difficulties and then ran out of time. I never expected that Sunday, a non-work day might be the day that I run out of time. I had seem some recent Excel maps and made a blog post about this one. At the last minute decided to try one. Last Spring I tried my hand at a cross stitch map of Rochester, New York. This seemed like a natural fit for an Excel map since it is very grid-like. Instead of doing land use though, I tried doing one of those HOLC redlining maps from the 1920's. 

Lack of time forced me to go very low res. so the map ends up looking like not much at all.

Day 15 - Theme: Map made without using a computer. 

Several of the previous maps were hand drawn but I decided on a different approach here. This is a souvenir Pennsylvania cutting board stacked with coins representing the GDP of the metropolitan areas of the state. One cent = $1 Million. It's a nice, even formula but does not make the stacks high enough to really show the pattern well. Since it is helpful to see multiple angles, I created this mediocre video.

Day 16 - Theme: Urban/rural

This was mostly just an exercise in image manipulation to tease out the urban and rural areas by land cover. I picked Charlotte after looking for cities that might have an interesting looking pattern.

Day 17 - Theme: Land

While waiting in the San Diego Airport a few years ago, I noticed a display of Kumeyaay culture. I was unaware of these people as I suspect many are. There were a couple of maps which I later found copies of on a website dedicated to Kumeyaay culture. I find it interesting that their territory predates the US-Mexico border which has been imposed on their land. This is what the area looked like pre-border.

Day 18 - Theme: Water

This was just a fun exercise in grabbing some water data from northern Quebec and overlaying it on top of a cheesy tree pattern that I made just for this purpose. More art than map. The large lake in the west is Lac Couture, an impact crater.

Day 19 - Theme: Islands

I've always been fond of Christo and Jeanne-Claude's Surrounded Islands installation so I decided to map it. Buffering is one of the most common and basic GIS functions (ie. is this property within 200 feet of the river?), here was an example of a real world buffer.


More to come (I hope).

Wednesday, June 23, 2021

The Southern Underground Railroad

Mexico outlawed slavery in 1829. Texas fought for independence from Mexico in part to be able to reestablish slavery there. For those seeking freedom from Texas and other nearby states Mexico was a much closer destination than Canada. It was a much tougher trip than for those who went north without the support and protection available in free states. Most who tried to escape to Mexico likely never made it. Still Stephen F. Austin State University's Texas Runaway Slave Project has documented over 2,500 escapees.

Illustration by Erwin Sherman via Texas Highways 

Runaways may have been helped by Mexican immigrants, German settlers who were opposed to slavery and by their own skills at horseback riding. Crossing the Nueces Strip, the hot, arid land between the Nueces River and Rio Grande was particularly difficult but with a horse and a gun, it was possible. 

Once in Mexico there was still much adversity with few job opportunities, a language barrier and little local support. Still it was better than being enslaved. 

Without a major support network there are not established routes to map, just general flow patterns as seen on the map above. This map that commonly appears on the web shows a general flow southward through Texas in addition to the more commonly known routes.

via Pinterest

 More info at Texas Highways

Wednesday, September 11, 2019

Deaths in the Desert

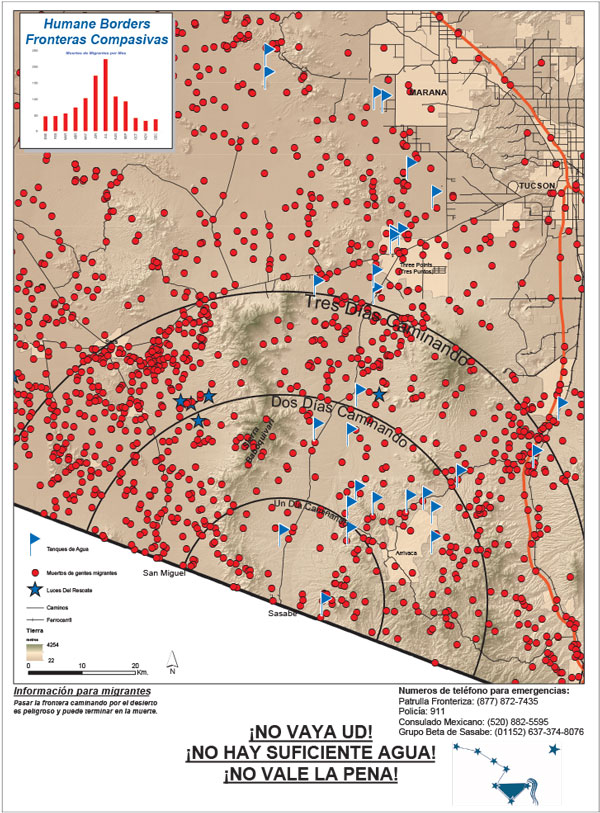
Since 1999 over 2000 people (probably even more since this source is a few years old) have lost their lives crossing the desert in southern Arizona. Traditional border crossings have been closed off forcing many migrants to cross in desert areas - places where the government thought the harsh conditions would deter people from crossing. These deaths have been documented by the Tucson Samaritans, a group dedicated to saving lives
http://www.tucsonsamaritans.org/uploads/5/5/9/6/5596304/2015-2016-whole-area_orig.jpg
 Here is a closeup of the Ajo sector for a better idea of the terrain.
Humane Borders, another group of volunteers trying to save lives, made posters for distribution on the south side of the border warning potential undocumented migrants of the dangers they face trying to cross through the desert on foot. The text in Spanish at the bottom translates to “Don’t do it! It’s hard! There’s not enough water!” The posters include estimated walking times from various entry points, as well as the sites of migrant deaths and the location of water stations.
https://www.humaneborders.org/wp-content/uploads/sasabe_poster_913_2016.jpg
They also created maps showing deaths that include location of water stations, rescue beacons and land ownership,
as well as an interactive map where you can look up names and filter deaths by location, year, land type or cause. Here are deaths from exposure.
A closeup of an area near the Organ Pipe Cactus Wilderness gives a good sense of how bleak the landscape is.
A click on the points helps to humanize each death-something many of our politicians are unwilling to do.


Wednesday, April 3, 2019

South and Central America According to Fox News

I think this map is old but has some new relevance due to this recent Fox News screen shot, as summed up in a tweet by Atanas Entchev.

The map is credited to the Dispropaganda site but I could not find it there.

Wednesday, February 13, 2019

Cards Against Humanity Stops the Wall

Cards Against Humanity is a self-described "party game for horrible people." As a protest against a border wall that is by any objective standard an ineffective waste of huge sums of money, they have purchased a plot of land along the US-Mexico border and hope to delay construction by forcing a lengthy eminent domain case. Since the wall is "12th Century Technology" they have also purchased a trebuchet, a medieval device (not the font) for catapulting objects to destroy walls.

What does this have to do with maps? Well, they made one.
The map is filled with puns and some other strange things that I don't understand such as Smashmouth playing a concert in Mexico. You can also see the trebuchet doing some damage and people climbing over the wall with ladders.

More on the project here.

Wednesday, February 7, 2018

More Map Acquisitions

Map Acquistions - Part Two

Central Leningrad from a city guide by Intourist,  travel service of the U.S.S.R, circa 1976.
Another view of Leningrad, Falk plans, Hamburg, Germany, 1976.
A very schematic map of Moscow from Intourist.
Tourist map of Milan - the eye watering color scheme and overly fussy level of detail make it a treat to try and read.
Bus guide-Barnet, North London
A "Parking Disc" for North Yorkshire - set the time of arrival and display on your windscreen. Fail to display the disc and you have "committed an offence."
Hughes Airwest map of Guadalajara,
and Puerto Vallarta
Here's something I haven't come across before - an uncredited map. There is no publishing info but here's the cover.
There are some nice details on it,
 with this odd inset - I guess showing the extent of streets in 1947. Except where they masked them under "San Francisco"
Finally, a personal favorite since I vacation here, "Damariscotta Boxes the Compass" a map with a ridiculously prominent compass.

The houses and churches are drawn so large you can't tell where they're located. This is from the Damariscotta Information Bureau - we still use their maps but they are much more legible these days.