Wednesday, November 30, 2022

Thirty Day Map Challenge 2022 - Days 25-30

Here’s the final group of maps!

Day 25 - Two Color

When I saw the two color category, I immediately thought of “Black and Yellow” by Pittsburgh hip-hop artist Wiz Khalifa. I’m not sure why but I went with it. As a native Philadelphian I’m supposed to hate all things Pittsburgh but I like how they have a color code that their sports teams follow. I don’t think any other major city has that. 

This map is similar in style and technique to Day 4’s green map of Greenville. One could argue that this is really a one color map, go ahead if you want.

Day 26 - Islands

Like day 25, I just went with my first thought. I don’t know Indonesia very well and as the world’s fourth largest country by population, a little knowledge can’t hurt. I decided to go with simple shapes as much as I could while also trying to represent that several islands are split among other nations, where the shapes needed cutting. 

Day 27 - Music

This should be pretty self-explanatory if you know the songs. The place names are written as they are sung so that is why some have state names and other don’t.

Day 28 - 3D, Day 29 - “Out of my comfort zone”

3D mapping is out of my comfort zone so while I did post separate maps for each day they were both done using the same data set. I used Blender, a wonderful, but also difficult software package and grabbed a digital elevation model of Madagascar. As shown in the above image the island appears to be sinking into the Indian Ocean. This is due to a combination of a model that needs more work and my own Blender knowledge limitations. I think a bit of 30 day map challenge fatigue was also beginning to take its toll on these maps.

For Day 29 I posted this animation of me flailing about in Blender, trying to figure out which side of the model looks better. 

I found a way to carve out a piece of island (the northwestern Boeny region) that looks sort of not bad. 

Credits to Klas Karlsson and Daniel Huffman for their very helpful tutorials on Blender.

Day 30 - Remix

Similar to Day 20’s “Map of my Favorite Maps”, here is a map of the maps. They’re not all shown as some areas are too small and some have overlapping geographies. I used a few 2021 maps to fill in some empty spaces.

It’s been another mostly fun but also exhausting ride. I need to focus now on everything else I’ve been ignoring in my life and get some sleep. Be back (maybe) next year.


Thursday, November 24, 2022

Thirty Day Map Challenge 2022 - Days 17-24


More maps, because I just can’t stop myself.

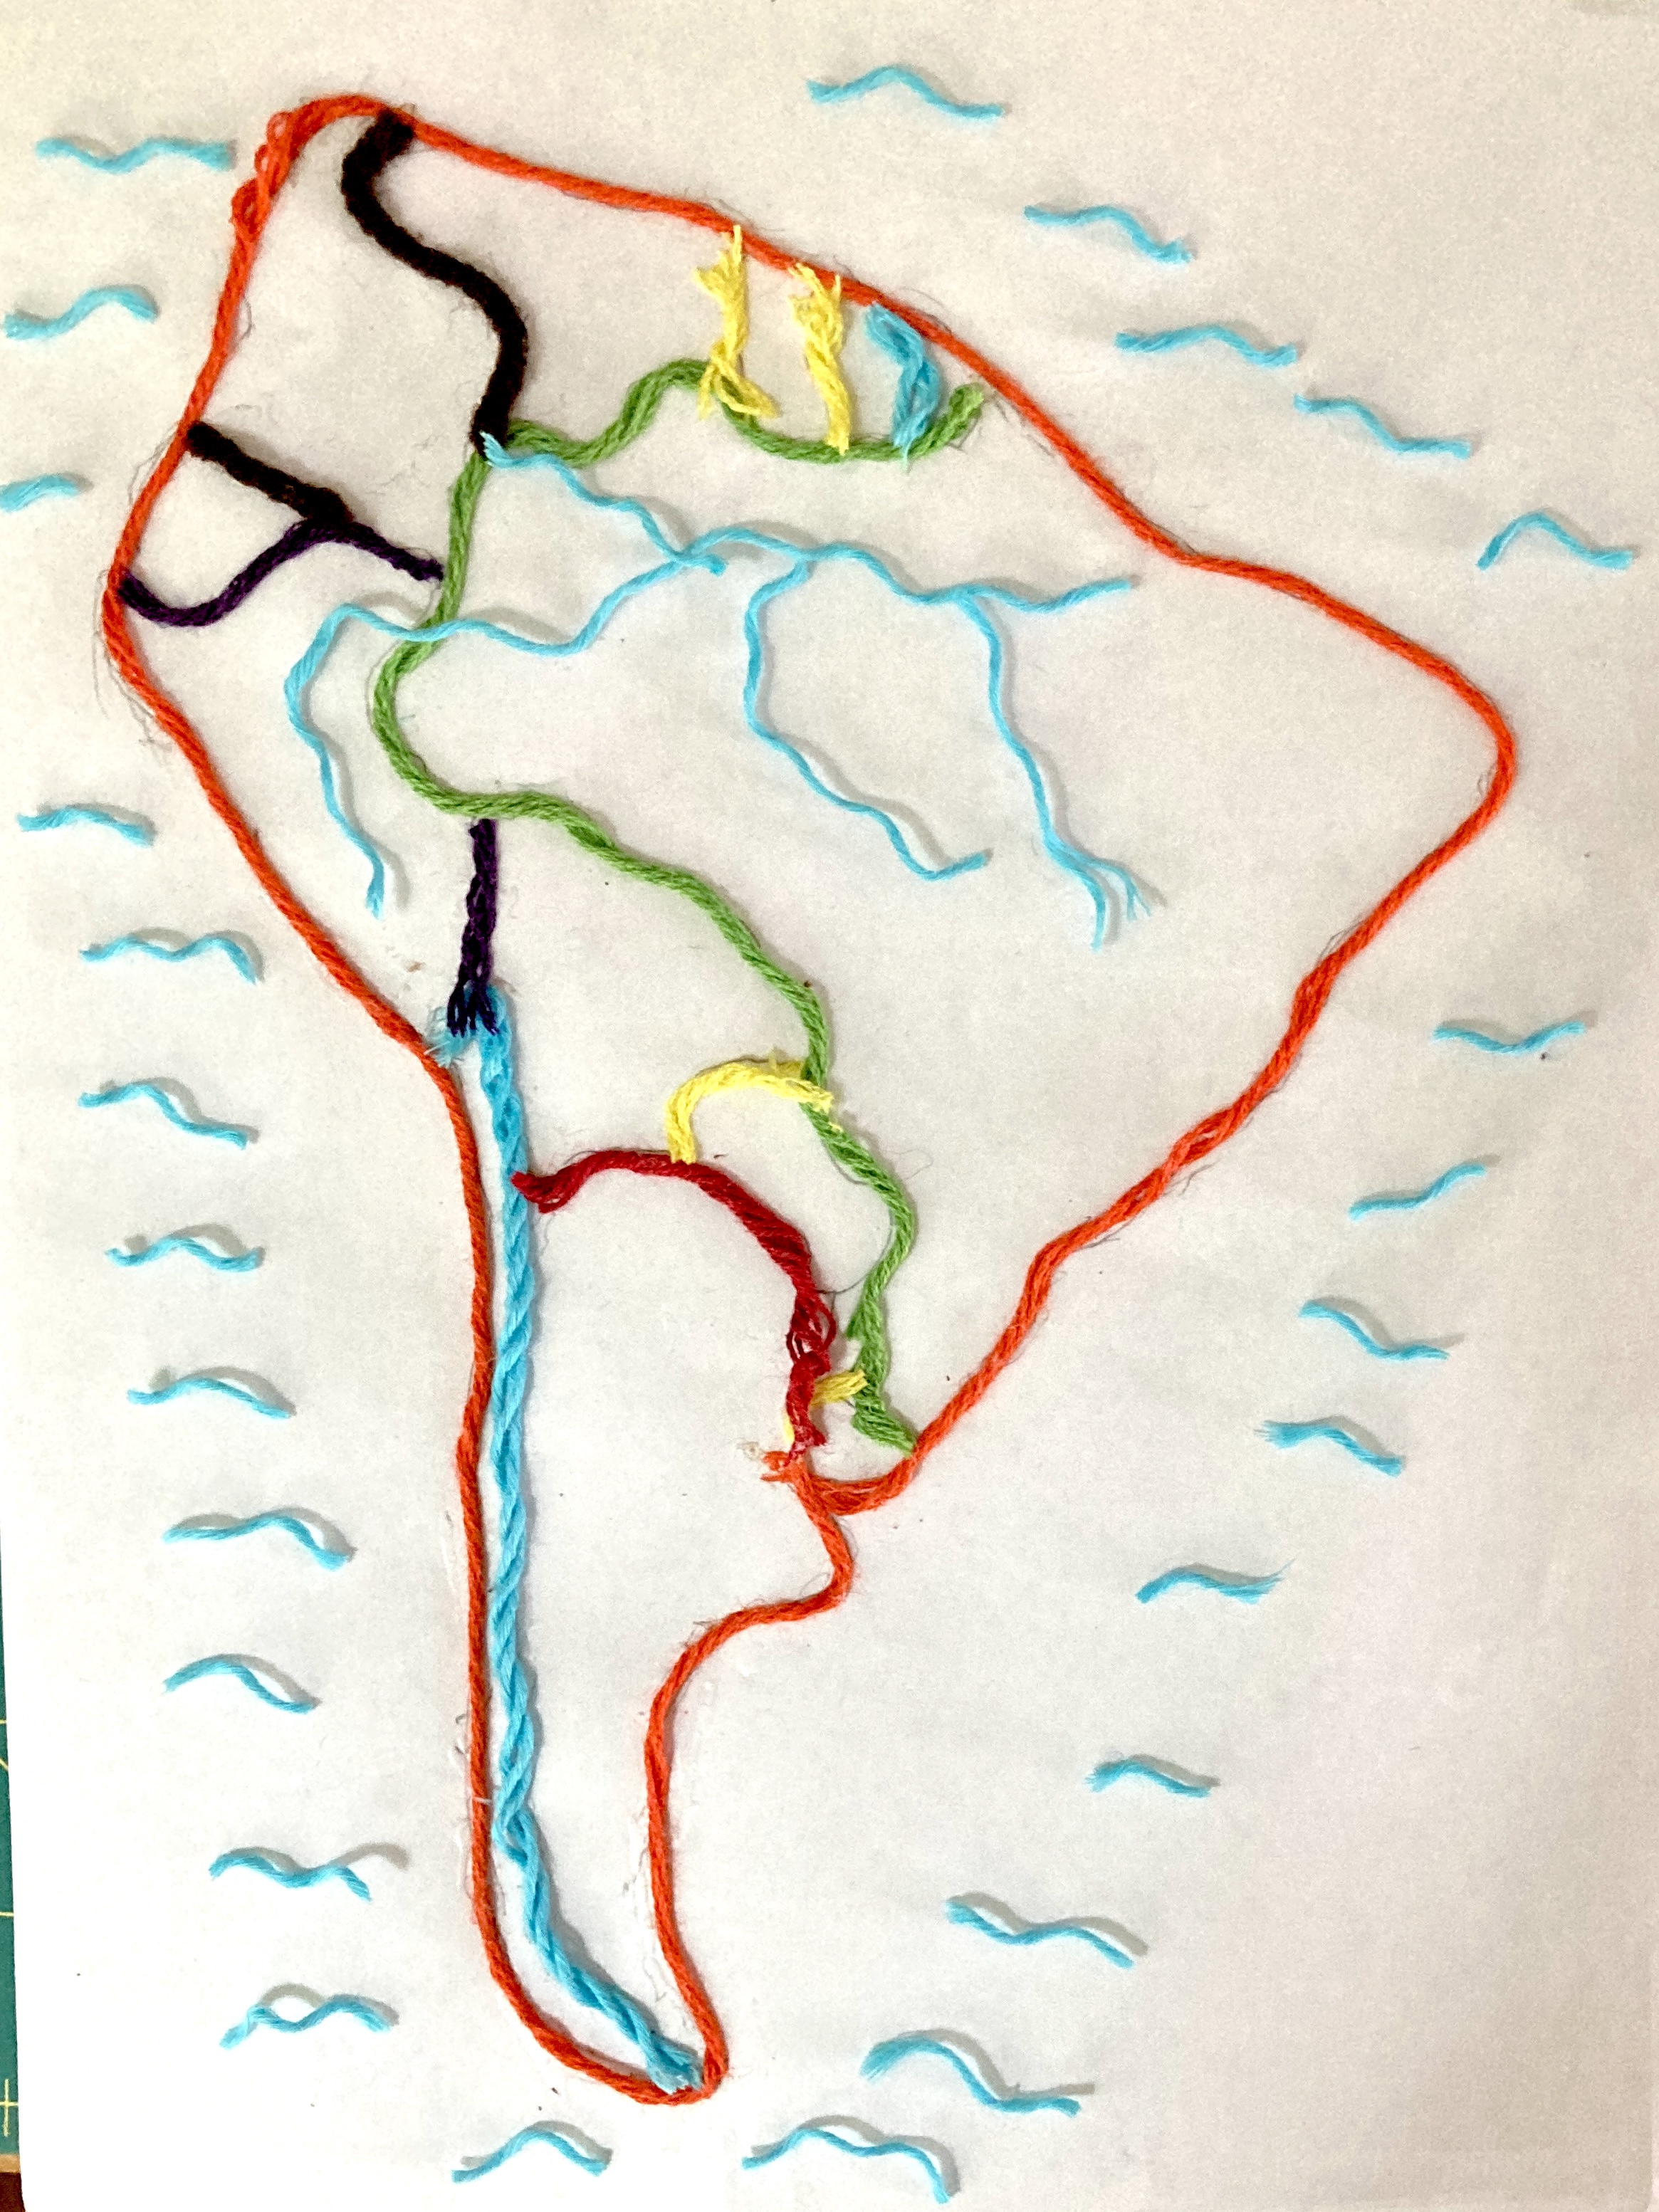
Day 17 - A map without a computer

A yarn map of South America. Some of the yarn was glued to paper. The glue didn’t always go where I wanted so Paraguay got mushed. The Amazon and its tributaries were laid on top without glue.

Day 18 - Blue

After seeing an article in the newspaper about sunny vs cloudy cities, I dug into the NOAA web site and got the major weather stations with their coordinates and percentage of sunny days. 

Day 19 - Globe

I was feeling unsatisfied with my Day 15 (food and drink) map of wine regions (here it is again) because it only shows one of the many good wine regions in the world. 

Here is a more “global” view.

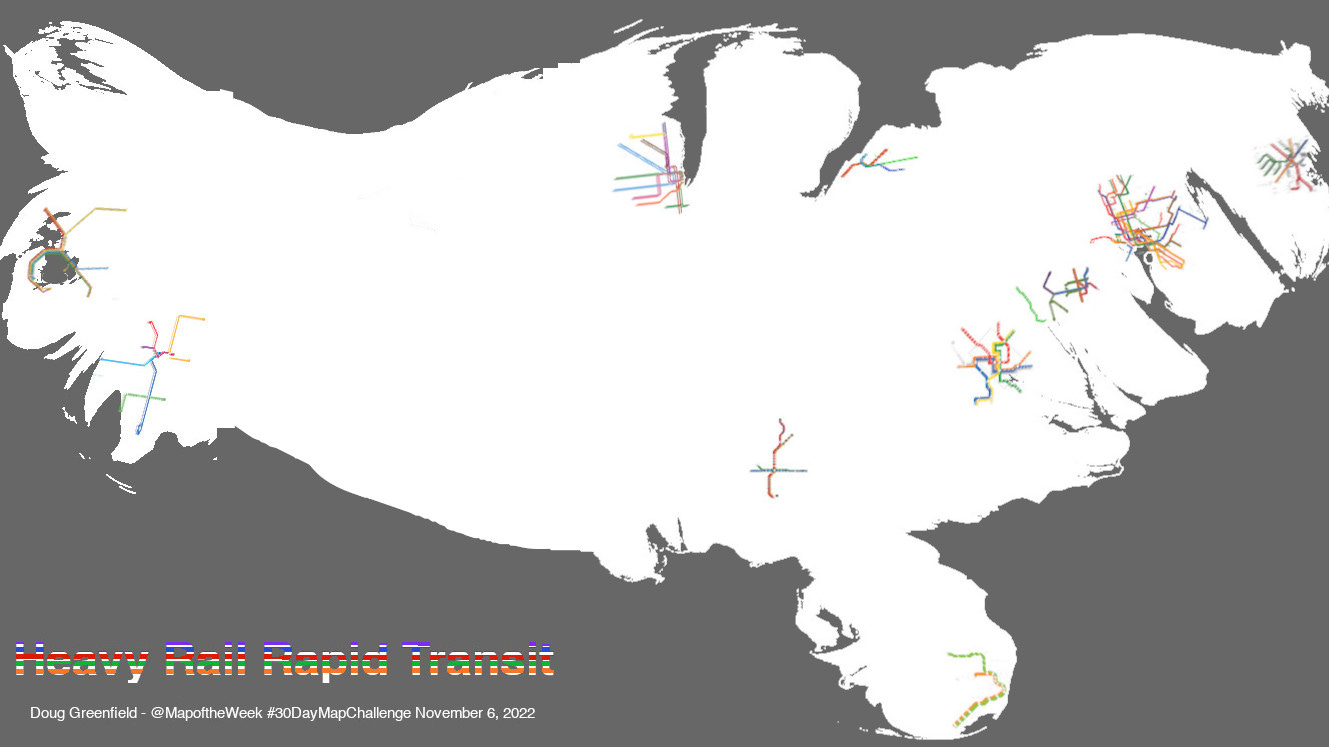
Day 20 - My Favorite…

A map of my favorite maps. This idea was good in theory, less so in practice. It’s almost impossible to see what’s going on here without blowing this way up and reading the tiny text at the bottom. I have many other “favorite” maps but these were chosen for their geographic spread.

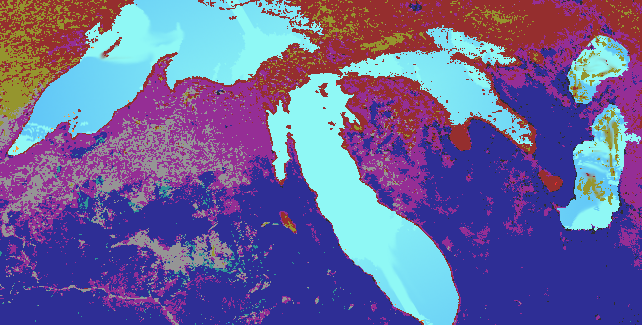
Day 21 - Kontur Population Dataset

Like probably most people, I did not know anything about this dataset until the morning if the 21st. As far as I can tell it’s just population counts, no other demographic information, so most of the maps for this day were density maps. This dataset is huge and was killing my poor computer so I grabbed a small area to make it manageable. South America was the first place that drew so that why I chose Buenos Aires. 

Day 22 - NULL

Null Island in geographer lore is an island in the Gulf of Guinea (there’s no island there) where latitude 0 meets longitude 0. You may see maps with points mysteriously showing up here because the data has null coordinates. I get this kind of thing regularly at my job when we map school children for size projections, busing and redistricting. Almost every list I get has at least one if not many post office box addresses so the coordinates are NULL. I could just say they live at the Post Office and that would be more accurate than the Gulf of Guinea but that requires extra work and would still be wrong. 

Day 23 - Movement 

For the busiest day of Thanksgiving travel, here are travel paths as millions criss-cross the country. I got the top 30 metro areas but after I was done I noticed that New York City somehow got removed. It wasn’t intentional, really!
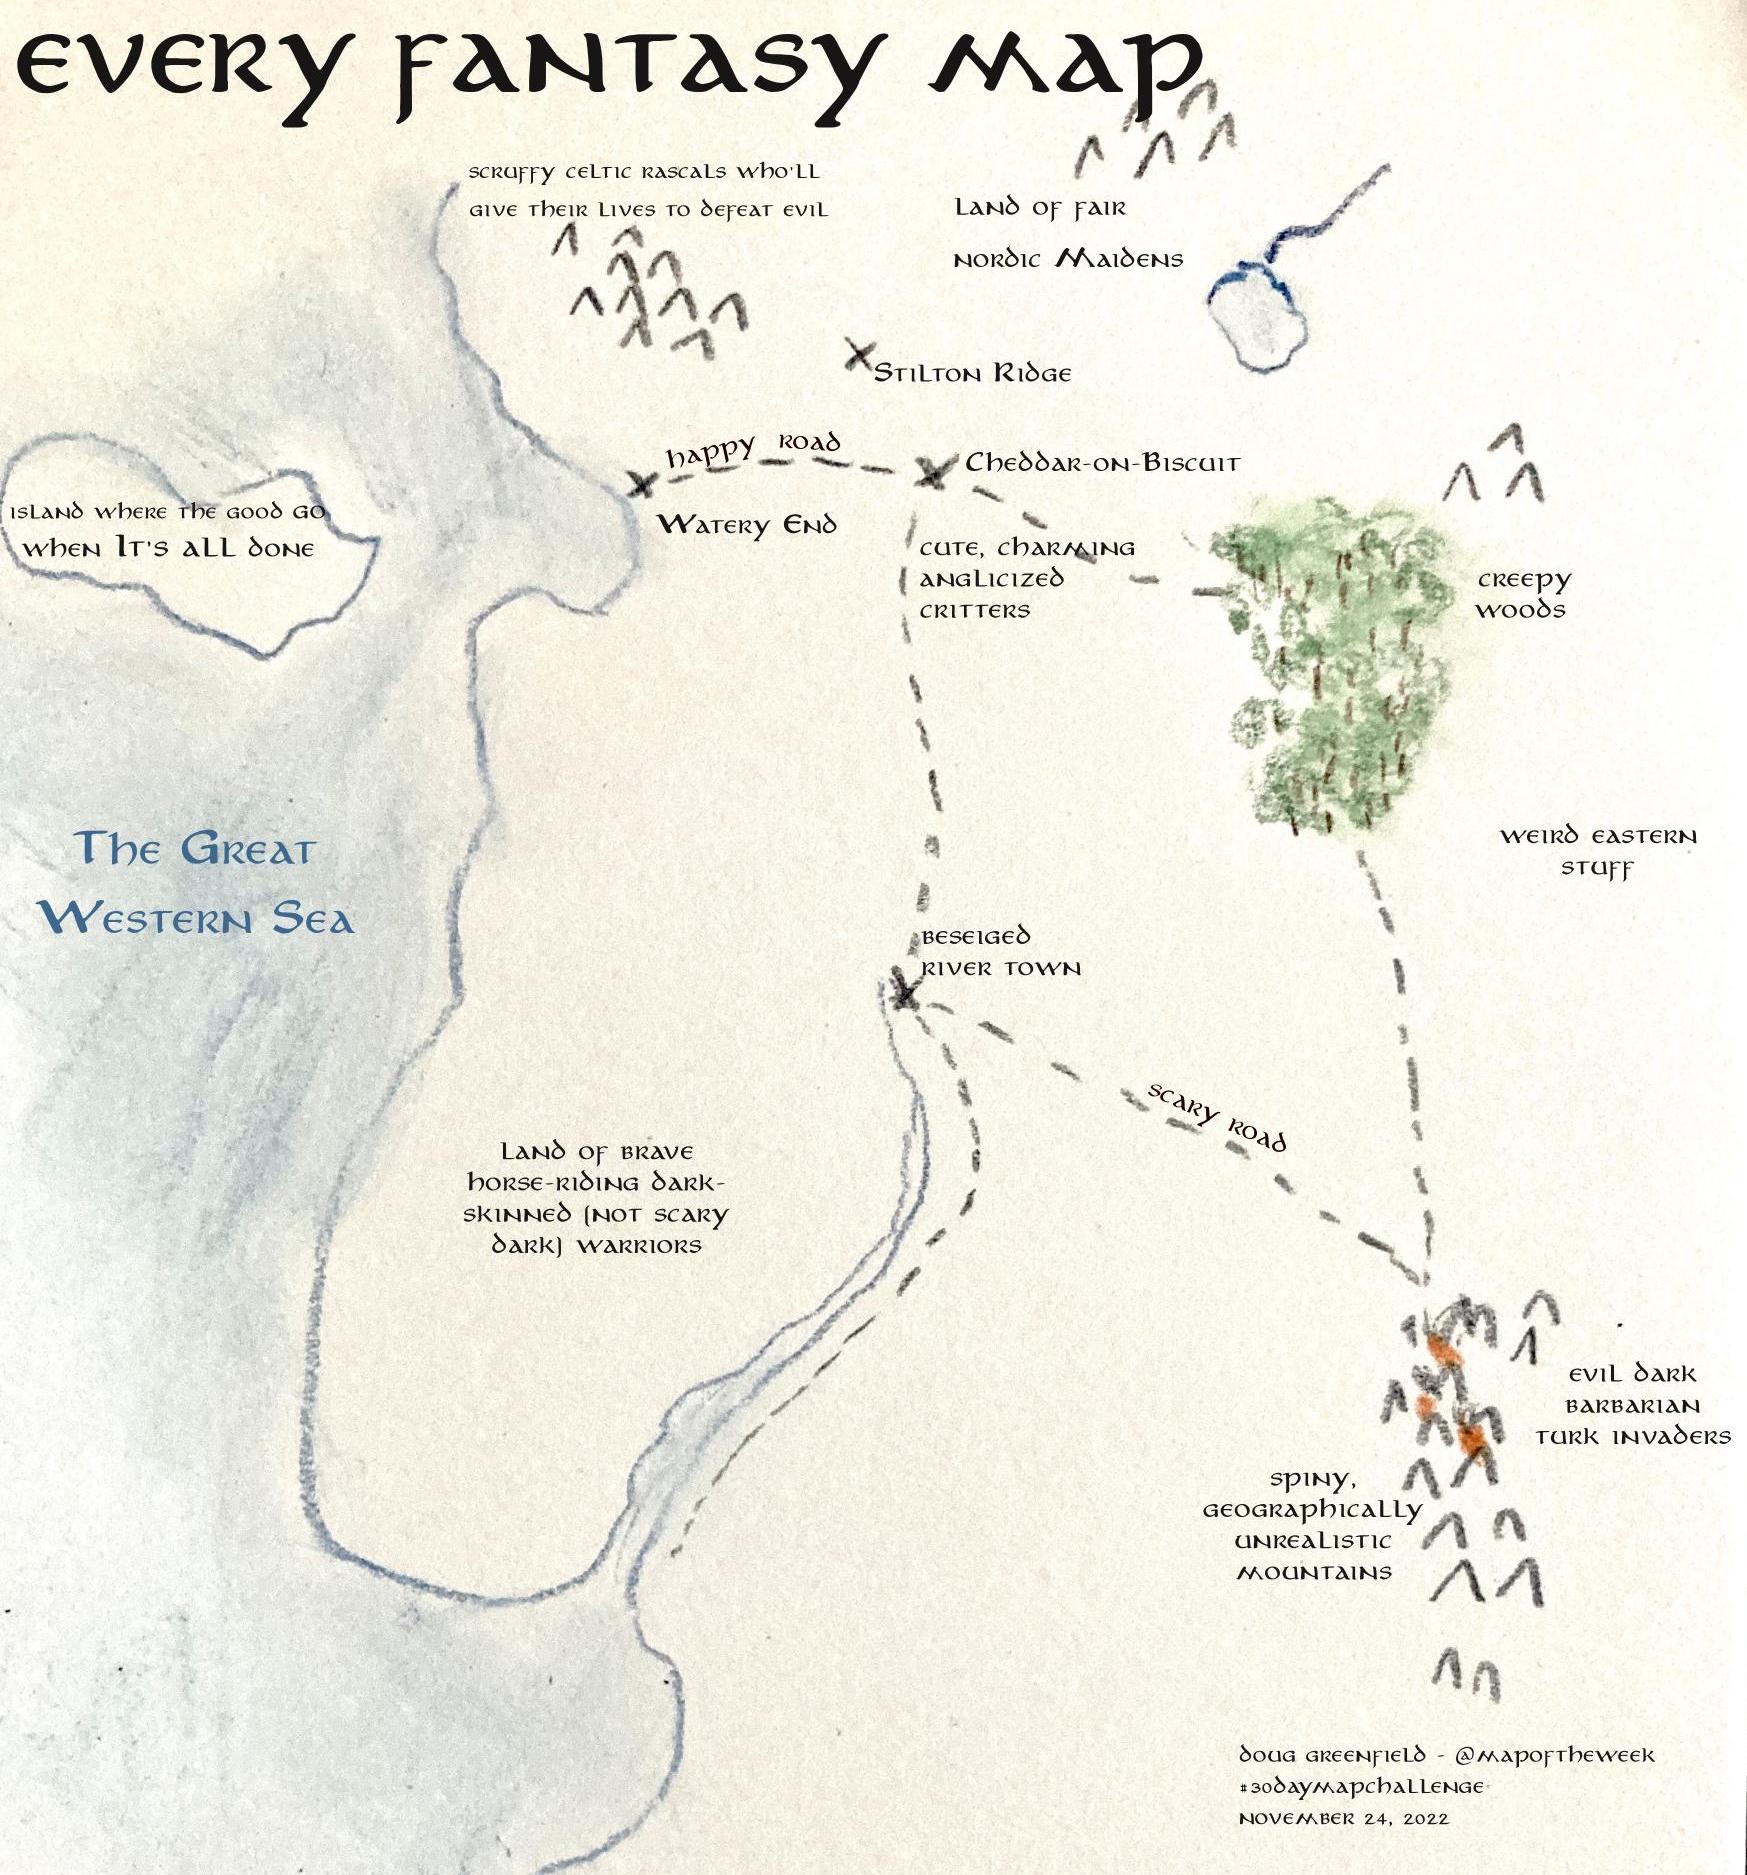
Day 24-Fantasy

Wednesday, November 16, 2022

Thirty Day Map Challenge 2022 - Days 10-16

This last week of the #30DayMapChallenge has felt a bit underwhelming but it had it moments, such as…

Day 10 - A Bad map

Many people had fun creating actual bad maps. I thought it would be interesting to see a map with “bad” written in a bunch of locations, which then made me think of Michael Jackson. This is a map of his 1988 “Bad” tour. Some maps just look better without a title IMHO.

Day 11 - Color Friday: Red

The red tide is back in parts of Florida so I drew a map of it.

Day 12 - Scale

A little fun with scale comparisons. Why Delaware and not Rhode Island, the smallest state? Mainly because Delaware’s somewhat compact shape shows up more clearly. Maybe also a bit of personal family connection bias.

Day 13 - 5 Minute Map

A map of Wyoming drawn on two sticky notes - that’s all.

Day 14 - Hexagons


Last year on hexagon day I created hexagons for the state of New York. Rather than make a new hex grid I reused this one. These are colored by mean elevation color as shown on OpenTopoMap. It was an interesting exercise using zonal statistics and image resampling. I could tell more but you’re already half asleep reading that last sentence.

Day 15 - Food and Drink


I got all the wineries worldwide from OpenStreetMap and had been playing with this type of blurred dot symbology. This data may show up again on a future day as I am looking for better ways to show all the regions of the world in one map. In the meantime this one focuses on the most prevalent wine production areas.

Day 16 - Minimal


As a frequent traveler on Amtrak, here is a minimal map of the Acela, chosen because there are fewer stations than on the standard Northeast Corridor routes. This is a bit of a strange hybrid process. Originally it was a hand drawn and labeled map but then I decided I hated my sloppily written labels so they got computer text. The only hand drawn element remaining is the line. I’m not sure how well this combination works but I like the way the text looks.

More self-indulgent fun next week!

Wednesday, November 9, 2022

Thirty Day Map Challenge 2022 - Days 4 - 9


Yes, November is the month when I get to be self-indulgent and show off my #30DayMapChallenge maps so here come some more. The daily theme is listed after each day.

Day 4 - Green

For green day I made a map of Greenville, the one in South Carolina, giving it the 1980’s computer screen look. I brought down the resolution a bit for the pixellated feel and found a font from that era.

Day 5 - Ukraine

Locations of sunflower fields in Ukraine were taken from this Wikimedia Commons page. Most of the photos have location coordinates listed deep in their metadata. I used a caricatured country outline from Project Linework, except for Russia (not included in their data) which I drew my own coastline for.

Day 6 - Network

This was not my most successful idea but I’d been working on overlaying transit maps onto a cartogram (so the large urban areas have space). To be as objective as possible and keep this project from blowing up, I only used the “heavy rail” systems as listed by Wikipedia. The page lists 15 systems covering 12 metropolitan areas. I did not include San Juan, Puerto Rico because it’s not part of this cartogram. If I started including cities with “light rail” systems, I might need to add various suburban commuter systems and it would be a large slippery slope that I might never get up from. The cartogram was modified to remove some of the large empty area between Chicago and Los Angeles.

Day 7 - Raster

I may have “mailed this one in” a bit but I wanted to play with some color manipulations in GIMP. The original image came from this page from University of Michigan. I like the perspective.

Day 8 - OpenStreetMap

OpenStreetMap is the Wikipedia of geodata. I grabbed some ice cream places and mapped the Ísbíltúr - Iceland’s ice cream road trip tradition. All data including the coastlines and parks are from OpenStreetMap.

Day 9 - Space
 

I’ve never been to the Maine Solar System in Aroostook County but I hope to see it some day. Here is a map showing where the planet models are located. More on the system here. The picture of Saturn in situ was taken from Google, user Amy Doucette.

Thursday, November 3, 2022

Thirty Day Map Challenge 2022 - Days 1-3

November is back and that means another #30DayMapChallenge, making a map each day based on a given theme, For more background on the challenge see this post from last year. Here are the first three days as posted on my Twitter.

Day 1 - Points

The original points came from the Maine Geodata Library. However, these only included towns with “point” in the name which are not many. For example, there is no town called "Pemaquid Point" so it was missing. I got some additional names from various web searches. The inland points were particularly difficult to find-most of these are on lakes. In the final map some of the points got dropped by the auto-label function to reduce clutter, so this is not a complete list.

Day 2 - Lines

This is the most wordy map I’ve ever made. I’m not a huge fan of the overly information-dense National Geographic style maps because it’s just way too much to take in, but this map needs some explanation. I’ve been fascinated by the Haskell Free Library and how it straddles the US-Canada border. A few years ago I finally had a chance to visit it. I took the photos of the black line marking the border and generated the data myself as most of it did not exist from what I could find.

I had to drop my accuracy hangups to make the map more legible. Originally I had all 9 flower pots in their exact right locations. It was unreadable so I spread them out a bit but eventually found that I needed to get rid of a few to keep the map from being a messy jumble.

Day 3 - Polygons

While Lawnstarter is not necessarily the world’s foremost data site, sometimes you have to go where the data is. I was trying out this leaf coloring scheme with its random colors and angles so I looked for a fall foliage by state guide. I found a best “fall scenery” ranking by State from Lawnstarter 2022’s Best States to Visit This Fall  There’s an overall ranking but there is also one specific to fall scenery.

I had trouble coming up with an ideal density function in limited time so some of the larger states look a bit more sparse to the benefit of states like Delaware.

I’ll have many more of these to post throughout November.