Showing posts with label pittsburgh. Show all posts

Thursday, October 12, 2023

Pittsburgh Week

This week I am attending the North American Cartographic Information Society (NACIS) meeting in Pittsburgh so I haven't had time for a proper blog post. There's lots of great stuff here that may make for future blog posts but in the meantime here are a few random maps I've come across.

Here is a map of the original Fort Pitt, located on its site at Point State Park. The park and fort remains are located at the confluence of the three rivers (really two rivers coming together) and the location just feels  important. This is a look out from the point with another map in the ground, looking out at the newly formed Ohio River,

and a view from above on Mount Washington.

I got up and down Mount Washington via the two remaining incline railroads. Here is the busiest part of a map hanging at the incline station of all the historic inclines.

I took number 2 up and number 4 back down, the rest are gone.

Finally, a NACIS tradition is the quilt - using maps various members create of the host city, pieced together.


Wednesday, October 21, 2020

What Can We Learn From Orientation

This week's popular distraction on the geo-webs is an app that draws every street in a city (or other location) colored by orientation. Here is one of my favorite personal places, Philadelphia.

While seemingly just a meaningless distraction the colors do tell you something about settlement patterns. Settled on a part of the Delaware River that runs due south and then west, the major part of the city is along an almost north-south (red) grid. However most of the river flows at about a 45 degree angle and much of southeastern Pennsylvania is on a grid shaped by the river's direction (the purple and blue lines). In the outer parts of the city these grids collide creating some of the more interesting urban spaces in the city (IMHO). Here is the southeastern part of Pennsylvania. I expected to see more purple but there is still quite a bit in the northern regions of the metro area where I grew up.

Note that the app allows you to change the background color. For most of these images I set it to black because the roads show up more clearly. 

For a more meta view here is all of Pennsylvania.
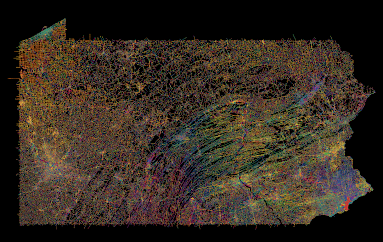
I do not recommend loading an entire state as it takes a while and may overwhelm your computer (and their server).

Points of interest include the colorful twists and turns of the central valleys and ridges, the separately unique Lake Erie grid, and the holes in the northern forests where no roads run. As a different type of city Pittsburgh, one of the toughest cities in the country to navigate, is quite colorful. There are still many grid neighborhoods but they run at all kinds of angles, often at the whims of the rivers.
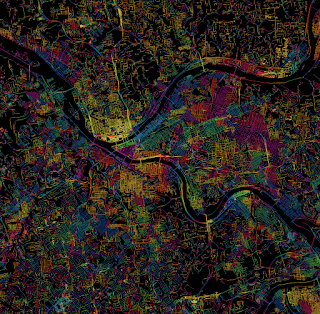
Pittsburgh-taste the rainbow!

For a suburban view, here is the area around my childhood home in Levittown, PA. The blue lines in the upper left corner are from a shopping mall parking lot.

Many cities in the western half of the United States strictly follow the township and range grid of the public land survey system. Often the downtown areas run at an angle either to follow a railroad or to accommodate an older grid system. Here is Denver. 
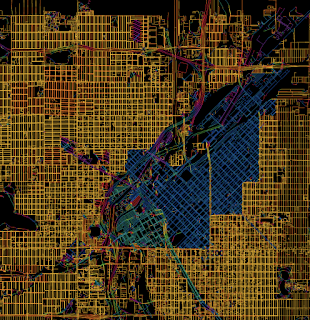
Denver-embrace the yellow!
As a proof of concept here are four other cities with a similar pattern.

I could go on about this for way too long but I'll end with an artistic mashup of some of the more interesting and colorful places I've explored in Philadelphia. You can explore you favorite places here.
 

Clockwise from top left - the art museum area, the effect of the Schuylkill River bends, roads curving around the airport runways, the way Roosevelt Boulevard breaks up the northeast grid, some curvy suburban colors, and a difficult to see Logan Circle.

Wednesday, September 14, 2016

The Bridges of Allegheny County

The Evolution of Pittsburgh's River Bridges is an interactive map companion to the book, Pittsburgh's Bridges, from the "Images of America" series
Bridges are color coded by type and the slider in the upper left corner lets you see what bridges existed over the last 200 years. You can pan and zoom and click on a bridge for details from the book.
Yes many of them are yellow!
Where photos are not available there are diagrams of the bridges.
The map was produced by Lauren Winkler, who also made a nice map poster for the book.
http://skeetidot.github.io/maps/Pittsburgh_Bridges_Poster.jpg

Bonus map - Pittsburgh's bridges in 1902-animated birds-eye view!
http://www.wired.com/wp-content/uploads/2014/12/ColorPitt1902_1200px.gif

Wednesday, November 14, 2012

In Search of a Better Election Map

The Stanford Election Atlas shows election results by polling location. This reveals voting patterns that are not apparent when using the standard state or county maps. Unfortunately last week's election results are not currently mapped so we are looking at the 2008 presidential election.


The map still looks more red at a national scale than the vote actually went (due to the heavy clustering of urban polling locations) but it's not as unbalanced looking as the state and county maps. Two unfortunate aspects of this map are the Platte Carre projection (where Maine appears to be falling asleep from lack of interest) and the ESRI interface. I use ESRI interfaces enough at work to be frustrated with them. You can click on any point to get some detailed statistics and an ugly looking pie chart.

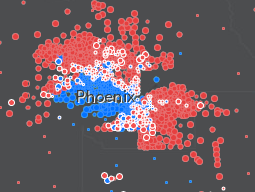
When you zoom in notable patterns emerge such as the cotton belt in the south that I've mentioned in a previous post. Most cities have the standard blue core surrounded by a ring of red. Good examples include Minneapolis and Pittsburgh.


Note the lines of blue along rivers and railroads radiating out from Pittsburgh. This patterns shows up even more clearly along the east coast Metroliner corridor.


However, some cities have a more notable geographic split. Examples of these are San Antonio and Phoenix. I don't know these cities very well but there are almost certainly ethnic/racial divides that explain these patterns. 


A similar divide occurs on a broader scale in the Carolinas where the non-coastal east is strongly blue and the central and western regions are more strongly red.

 There are other maps you can choose and specific maps for some of the swing states. Hopefully they plan on posting the 2012 results in the future and maybe they'll find a better map projection too. Also, maybe the next map will include Oregon, strangely omitted here. Must be that Stanford-Oregon football rivalry.

Thursday, January 19, 2012

Gas Station Maps-The Early Days

According to Early Gulf Road Maps of Pennsylvania the Gulf Oil Corporation is usually credited with the first drive in gas station - on Baum Boulevard in Pittsburgh (where the company was headquartered) and the first freely distributed road maps.

Both of these credits are subject to debate - see footnote two from the article above, however the early oil company road maps were predominantly from Gulf. The first Gulf maps were made by W. B. Akins, a Pittsburgh advertising man. After a few years they switched to professional map making companies, first the American Blue Book Company, then Rand McNally and then H.M. Gousha after Harry Gousha left Rand McNally to start his own company.

Below are some details from a 1915 road map of Pennsylvania produced by the Automobile Blue Book Company and distributed by Gulf.


What is interesting (to me) about these maps is the importance of certain places (and lack of others) in the era before expressways.


The cover talks up "that good Gulf gasoline" and the "sterling qualities of this excellent petroleum product." It also advertises Supreme Auto Oil - "Its high viscosity renders it a perfect warm weather lubricant and its low cold test an Ideal Winter Oil, - as it flows freely at zero." 


In addition to road maps Gulf also distributed trip itinerary maps. Here are routes from Pittsburgh to Buffalo and Cleveland (marked in orange), with a listing of the places in between and the mileage. I like the quaint picture too.


Below is a 1917 "Half Day Tour" from Philadelphia to New Hope, Lambertville and Trenton. These tours list detailed routes but don't tell you what to see along the way or why you should go to places like Lambertville. They do tell you where to fill up your tank - in this case at the Gulf station at Broad and Hunting Park in North Philadelphia. Gulf only had seven stations in Pennsylvania and southern New Jersey at the time.


Of course I chose this tour for my own personal history. We lived in this area and took many of these trips.

Here is a 1925 Gulf map of parking regulations in downtown Pittsburgh. By then there were 14 Gulf stations in Pittsburgh. The takeaway from this map is to either try to find a space near the Point or on Congress St if you don't want to keep moving your car.


I will finish up with a detailed itinerary for the often changing Lincoln Highway, renamed Quebec Route 366 briefly in summer 2011. I have had inquiries about the specific route of this road - here it was in 1925. Street by street directions are listed for Pennsylvania. The New Jersey route is listed by town only.


Thanks to Historical Maps of Pennsylvania for the content of this post.

Wednesday, September 21, 2011

Map of the Week - Wear a Helmet!

NASA's defunct Upper Atmosphere Research Satellite is expected to fall back to earth on Friday, give or take a day. They don't know where but based on the satellite's orbit they've narrowed it down to somewhere between 57 degrees north and 57 degrees south latitude, in other words somewhere between northern Canada and the southern tip of South America - where just about everyone lives. The dark areas on the map below could get hit with debris.


If you're in Antarctica, you have nothing to fear, except for the fact that your continent has gotten huge on this map projection. For the rest of us there's a 1 in 3,200 that someone in this zone will get hit. The U.S. Strategic Command at Vandenberg Air Force Base will provide updates as the time gets closer. In the meantime watch for falling objects.


Wednesday, April 7, 2010

Map of the Week-Baseball Week 1

Here in the US of A the baseball season has begun! To honor the occasion I have a couple of baseball related posts. The indiemaps blog maps out where balls were hit. The first one is of a perfect game pitched by Mark Buehrle of the Chicago White Sox on July 23rd, 2009. The small blue dots are hits and the pink ones are outs. Click on the image to get to an interactive google map of US Cellular Field in Chicago where you can click each point for more information. Highlighted is a 9th inning home run saving catch over the wall that helped preserve the perfect game.


The blog entry discusses the details of how the maps are created using these diagrams from MLB Gameday. The points were converted from pixels to geographic coordinates. The diagram locations are based on observation and may not be as accurate as what you might pay to get from for-profit firms.


The next map, from a Phillies-Pirates game played at Citizen's Bank Park in Philadelphia, shows how different ballpark dimensions can affect the outcome of a game. The hit locations are shown (map on left) then transferred to PNC Park in Pittsburgh (map on right) to show how some of the home runs would have stayed in the park in PNC's larger outfield. Note that differing stadium orientations necessitate rotating the coordinates.


The entry continues with a long discussion about how to transfer the data and a link to the code on github in case you want to try plotting your own favorite game. Good luck! Go Phils!