Wednesday, December 22, 2021

Recreational Map of the Berkshire Hills

I'm spending a couple of days in the Berkshires in western Massachusetts. In the hallway where I'm staying hangs this pictorial poster map.

Produced in 1939 by the Berkshire Hills Conference, it is full of nice details as you look closer.

Here is the corner locator map, designed to look like a book with a charmingly misshapen Massachusetts.

The dark, woodsy marginalia makes the world outside of Berkshire County look spooky,

even with the happy sun shining on it,

while inside county limits people are happily golfing and fishing.

Finally here is an art deco north arrow plus mileages to other places so you don't get lost.

Wednesday, December 15, 2021

ATL Rap Map

I'm probably not the right person to post this given that my knowledge of Atlanta Hip Hop is basically limited to Outkast (upper left corner),

and my knowledge of Adult Swim where creator Joseph Veazy is a senior designer, is even more limited. Nevertheless the Atlanta Rap Map is a charming, hand painted map with lots of nice details relevant to that city's vibrant hip hop scene. Details like this horse on pink roller skates riding towards Bone Crusher's Bankhea(ddd)d.

Here is some downtown detail for your enjoyment.

Outkast makes their appearance below just north of East Point, just north of the airport, the only place I've been to in Atlanta - so far.
You can buy the poster here  - proceeds will be donated to HOPE Atlanta, an agency dedicated to fighting homelessness in the area.

Wednesday, December 8, 2021

Pearl Harbor

Pearl Harbor was attacked 80 years ago. Steve Walkowiak made a really nice map showing the Japanese first wave (red arrows) and second wave (purple) attacks. The damage to ships is shown as colored dots.

Click the image or this link to see the full map. The Japanese sent 353 planes in an attempt to cripple the United States Pacific Fleet. Here is a detail of the Battleship Row area.


Wednesday, December 1, 2021

Thirty Day Map Challenge - Part 3

Here is the final batch of maps for the #30DayMapChallenge. The first ten maps are here. The second installment here.

Day 20 -  Theme: Movement

The first plane trip I ever took. PHL to HOU with an hour layover in Atlanta.

Day 21 -  Theme: Elevation

I learned that you can make quick elevation profiles using Google Earth Pro and was curious what the Finger Lakes, some of which are very deep, would look like. Most of the work was in annotating the hills and valleys.

Day 22 -  Theme: Boundaries


At my day job I was asked to emulate a project from  the City of Columbus. When I first encountered that crazy boundary I didn't know what I was looking at but here it is. Many cities such as Detroit and Los Angeles surround well known enclaves but I've never seen anything close to this. Had some fun with the magnifying glass on the locator map.

Day 23 -  Theme: Data Challenge 3: Global Human Settlement Layers (GHSL)

Like many, I was completely unfamiliar with this data set. I still don't know much about it but I downloaded their built-up areas and drew them as if they were elevation, hills being the settled areas. I looked around for a good pattern and found Quebec City. In retrospect, I could have done a better job lightening the greys and changing the elevation quotient but there's only so much time in a 30-day challenge. I played around with some additional data layers in GIMP to create this image.

Day 24 -  Theme: Historical Map

I did some recent tutorials on how to create a historic looking map in GIS software.  The least historic place I could think of was Las Vegas. I got the buildings layer from the City of Las Vegas upon which I discovered that the main strip (including the casinos) is not even in the city but rather in Paradise, Nevada. Unable to find their buildings, I drew my own. I added an ad for wagon lumber. The text was inspired by other maps from that era. The title block was taken from a map of Las Vegas, New Mexico via the Library of Congress. Some image manipulation was used to change "N.M." to "NV" and the elevation from 6,400 feet to 2,000.

Day 25 -  Theme: Interactive Map

I enjoy hockey so I was curious about the world's second major league, Russia's KHL. Without reinventing the wheel, I made a similar interactive map to my previous ones of transit tokens and for New Year's Eve. Wikipedia was extremely helpful for providing both an already usable data set and the team logos. Above is just a screen shot. The interactive map can be seen here.

Day 26 -  Theme: Choropleth Map

For anyone that doesn't know the jargon, a choropleth is a map with areas colored based on data. In this case I tried my hand at a bivariate (two data variables) choropleth. This was based on a Tweet from the European Commission showing the relationship between COVID-19 vaccination rates and death rates. These maps can be hard to follow but the expected pattern should be yellow (low death rates, high vaccinations rates) to dark blue (opposite). The lack of red or orange shows that countries with high vaccination rates do not have high death rates. The confusion of the map is compounded by needing to flip the legend so that the high vaccination rates are at the bottom of the legend.

Day 27 -  Theme: Heat Map

It took 27 days but I finally thought to reuse a data set and made a heat map of Day 25's KHL data. I did not love the look of the original map (below) so I tried to hand draw it. It looks sort of nice but I misplaced the Moscow area and had to make up for it by adjusting some of the other locations. Here is the original computer generated version.

Day 28 -  Theme: The World is not Flat.

Once again working with the KHL data I tried my hand at a spherical map projection. This data is good for this because of the impressive longitudinal reach of the league. Those players do some long traveling!

Day 29 -  Theme: NULL

Going back to the theme from Day 26, I noticed that certain countries routinely had null data values for their vaccinations. Here they are.

Day 30 - Theme: Metamapping Day

I thought it would be fun to use this theme to show the locations and software used for my other 29 maps. However, the wheels came off the bus or I ran out of gas or some metaphor. I had numerous unexpected technical problems and finally just had to throw up my hands and put this mess out there. A couple of days got buried in the data or otherwise lost, the legend needs work and the US inset map is almost unreadable. 

This has been an excellent learning experience. I can't imagine going through this again which means I'll probably be back at it next November.

I highly recommend checking out other people's entries into the #30DayMapChallenge. There is some beautiful and wonderfully creative stuff out there.

Friday, November 19, 2021

Thirty Day Map Challenge - Part 2

Here are the next batch of maps I've posted for the #30DayMapChallenge. The first ten maps are here.

Day 11 - Theme: 3D

For the 3D theme I attempted to recreate an exercise from my first cartography class back in the 1980's. That exercise was done using a pencil and graph paper. Unfortunately, I do not have my notes or remember the exact procedure. I did this one using GIS software instead. The map shows murder rates by state. Back then North Carolina was #1, now it's Louisiana. The map is "upside down" so that the higher southern states don't block the view of the lower northern states.

Day 12 - Theme: Population

This is a map of Arctic settlements done "firefly" style, which is fashionable these days in cartography circles.

Day 13 - Theme: Data Challenge 2: Natural Earth

Natural Earth is a set of publicly available data. It is a collaboration involving many volunteer NACIS members and cartographers around the globe. Nathaniel Vaughn Kelso and Tom Patterson led the effort. They have produced some beautiful topographic images of the world. The map was also inspired by a NACIS talk on indigenous place names. The topography and streams are from Natural Earth, while the place names came from Canada's Open Data site.

Day 14 - Theme: Map with a new tool

This one is a bit of a mess because I started doing a tutorial using R, a new tool for me, but I ran into some technical difficulties and then ran out of time. I never expected that Sunday, a non-work day might be the day that I run out of time. I had seem some recent Excel maps and made a blog post about this one. At the last minute decided to try one. Last Spring I tried my hand at a cross stitch map of Rochester, New York. This seemed like a natural fit for an Excel map since it is very grid-like. Instead of doing land use though, I tried doing one of those HOLC redlining maps from the 1920's. 

Lack of time forced me to go very low res. so the map ends up looking like not much at all.

Day 15 - Theme: Map made without using a computer. 

Several of the previous maps were hand drawn but I decided on a different approach here. This is a souvenir Pennsylvania cutting board stacked with coins representing the GDP of the metropolitan areas of the state. One cent = $1 Million. It's a nice, even formula but does not make the stacks high enough to really show the pattern well. Since it is helpful to see multiple angles, I created this mediocre video.

Day 16 - Theme: Urban/rural

This was mostly just an exercise in image manipulation to tease out the urban and rural areas by land cover. I picked Charlotte after looking for cities that might have an interesting looking pattern.

Day 17 - Theme: Land

While waiting in the San Diego Airport a few years ago, I noticed a display of Kumeyaay culture. I was unaware of these people as I suspect many are. There were a couple of maps which I later found copies of on a website dedicated to Kumeyaay culture. I find it interesting that their territory predates the US-Mexico border which has been imposed on their land. This is what the area looked like pre-border.

Day 18 - Theme: Water

This was just a fun exercise in grabbing some water data from northern Quebec and overlaying it on top of a cheesy tree pattern that I made just for this purpose. More art than map. The large lake in the west is Lac Couture, an impact crater.

Day 19 - Theme: Islands

I've always been fond of Christo and Jeanne-Claude's Surrounded Islands installation so I decided to map it. Buffering is one of the most common and basic GIS functions (ie. is this property within 200 feet of the river?), here was an example of a real world buffer.


More to come (I hope).

Wednesday, November 10, 2021

Thirty Day Map Challenge - Part 1

 Several years ago Finnish cartographer Topi Tjukanov began the Thirty Day Map Challenge and it has run every November since. The idea is to create a map every day of November based on a theme he posts at the start. These maps are posted to Twitter using the hashtag #30DayMapChallenge. There have been some wonderfully inspiring maps created in this process. I had never participated before this year, correctly assuming it would take up a major part of my time and energy. 

As in other years, I had no plans to do this but on November 1st I suddenly found myself making a map and it took off from there. At the risk of being a self-indulgent show off here are the first 10 maps. As of right now I don't have an online portfolio so here is a place for me to post them. I'm hoping to continue on this challenge but time will tell if I make it to the 30-day mark.

Day 1 - Theme: Points

I'd been working on a general "where I've been" map and I got to thinking about places I've spent the night. I looked at a few states that either didn't seem interesting or had too many uncertainties when I settled on Ohio. I've been working on my weak artistic skills. This was drawn in watercolor pencils by hand while looking at a map of the state.

Day 2 - Theme: Lines


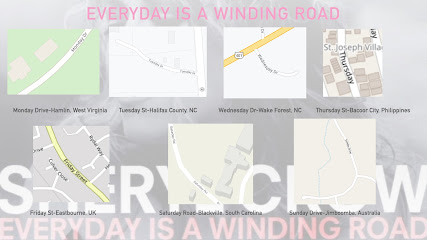
 I don't really like the song "Every Day is a Winding Road" by Sheryl Crow, but somehow it got stuck in my mind and I set out prove it. I used various mapping services such as Google, Bing, Apple and OpenStreetMap to illustrate examples of streets around the world named for the days of the week. One of the tricky parts was finding streets that are in fact "winding."

Day 3 - Theme: Polygons

Points, lines and polygons are the main building blocks of maps so each one gets a day. DC seemed like a good polygon city. I used Opendata DC to get my points. I removed some tiny triangles and it's possible I missed a few circles and squares. There are many rectangular parks that I didn't include because they don't have "square" in their name. I almost forgot about the Ellipse! 

This was a mixed media project. I made and printed a map using QGIS annotated it with pencils and put a little watercolor into the rivers.

Day 4 - Theme: Hexagons


Hexagons are a popular way to represent grids these days. Studies show that certain patterns are easier to detect with a hexagon grid than a square grid. They are particularly popular with election maps but I was looking to do something a little more creative. Not many things in nature are hexagonal. Bee hives use that shape but that kind of map has been done by many others.  While looking for inspiration, I discovered that some of Annie's Snack Crackers are hex shaped, including their saltines and cheddar crackers. I decided to use them as my hexagons.

    So where is a place that has both salt and cheese production? I settled on upstate New York, knowing where some of these places are located. The salt areas are mostly based on an old map I found showing salt deposits, mostly in the southwest. I also know of a couple of salt facilities from my travels so I put those in. I used the term "more likely" to cover the uncertainties but some of those hexagons in the southwest should probably be cheese. The cheese areas were determined by a combination of dairy farm maps and places I know that make cheese.

Day 5 - Theme: Data Challenge 1: OpenStreetMap


For the uninitiated, OpenStreetMap (OSM) is like Wikipedia meets Google Maps. Content is all user generated and it is freely available to use. Despite having contributed to OSM in the past, I don't have a lot of experience using the data so this was definitely a learning exercise. I knew that you can get things like businesses out of it so I tried a query on business names. For some reason, the first word that came to me was "monkey" so I grabbed all businesses with monkey in the name. After seeing an empty South America, I decided to add Spanish and then to make it a bit more objective I grabbed the other three of the world's top languages. In the process this became as much of a linguistic map as anything. 

There are many translation issues here. French and Spanish have different masculine and feminine words and the Spanish words (mona, mono) are contained within many other words and names. My Hindi translation must have been especially off since all my results came from outside of India. Anyway I did what I could here.

Day 6 - Theme: Red

Getting personal here. This is a map of the town where I was born. I was nervously waiting my turn to perform some music on Zoom and parlayed that energy into drawing. Like #1 I tried this completely freehand, while looking at Apple Maps. I've only been through Red Bank as an adult on a train so I don't know the place at all. Someday I hope to visit. The river west of downtown is very wrong and there are other mistakes. Also the map monster and train station were poorly done.

Day 7 - Theme: Green 

Staying in the realm of the personal, Rittenhouse Square is around the corner from my grandmother's former building. As a child I enjoyed playing here, especially with the goat statue. I also lived in the area briefly as an adult. I'd been thinking about how the same places look in different map services so I made an animation of the square using Apple, Google, Bing, Mapbox, Carto, Esri, Stamen, Mapquest, OSM and the philly.gov web site.

Day 8 - Theme: Blue

I started out trying to get a list of blueberry names using the Day 5 OSM theme but the results were not great. Next, I tried using the Google Maps API but also had issues with that. Finally, I found an embedded Google Map from travel-mi.com. I wasn't planning on a Michigan focus but because the data set was there I went with it. I already had a blueberry symbol from my What They Drop on New Years Eve map so I was good to go!

Day 9 - Theme: Monochrome

I thought one of those solar potential maps would look good in monochrome but I'm not sure it works. I also thought that light should be more sun but usually darker means more so this ends up being a bit counterintuitive. I also was not really able to get the subtle gradations of grays with a watercolor pencil. I probably should have tried charcoal instead. I don't trust my drawing abilities to do a complicated outline like this freehand. I traced it right off the computer screen. The rest was done freehand, making it "charmingly inaccurate". 
 

Day 10 - Theme: Raster

I made a very low resolution version of a satellite image of Australia. Then I made a fuzzy version. I couldn't decide which I liked better so I made an animation: blocky vs fuzzy


Though this challenge has taken up way too much of my time and thinking process, it has also been a creative inspiration and a great learning experience so far. I'm looking forward to some of the upcoming challenges with a touch of dread but also excited to take them on.

Wednesday, November 3, 2021

Mapping the Dream

For many years I had a recurring dream where I am exploring a non-existent neighborhood in Philadelphia. Despite its non-existence, it had very clear geographic parameters within West Philadelphia's University City area. I would take the subway westbound to approximately 33rd Street, walk through the area passing all the interesting urban things (coffee shops, clothing, book and record stores) that mostly don't exist there and get back on somewhere in the 40-something streets to go home. The picture in my head is clear enough that I decided to draw it.
I left the street names off of the drawing because they were not in the dream. The area breaks free of the grid pattern in interesting ways, revealing my anti-grid bias. Also in the dream I'm taking an underground subway whereas in reality it comes out of the ground and becomes a surface streetcar. This is what the area really looks like via a SEPTA map. The Baltimore Avenue trolley line is the closest thing to this subway. 

Using some photo manipulation I altered the map to the dream reality. I moved Baltimore Avenue northwards because I pictured the subway line as a direct continuation from 33rd Street.

Here is an animated comparison of reality vs. dream


Keep on dreaming!