Tuesday, December 24, 2019

Christmas Islands

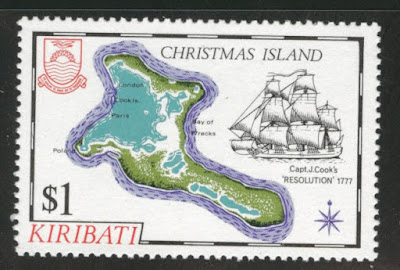
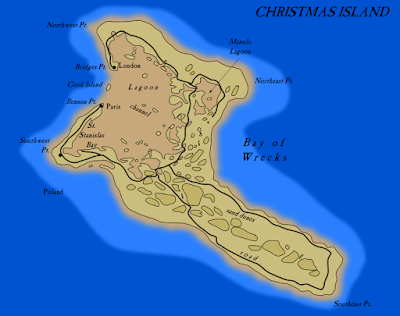
It is Christmas and Its been a busy time so please enjoy these maps of Christmas Island (aka Kiritimati)
http://svkwai.com/gallery/cxi-old-stamp/


https://www.enderra.com/2011/06/04/christmas-islands-map/
Via Enderra
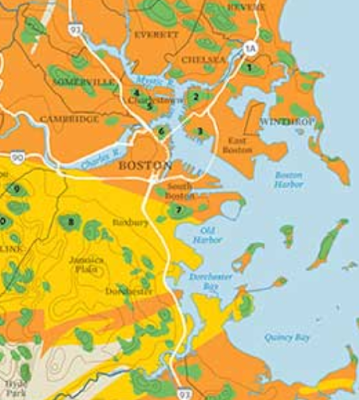
 Or, if you prefer the Christmas Island in the Indian Ocean.
https://i.colnect.net/b/5734/426/Map-of-Island.jpg

https://i.pinimg.com/originals/cb/22/3d/cb223d2ed17cadcb490d16af840a5a7d.jpg

https://www.worthpoint.com/worthopedia/map-postcard-christmas-island-indian-245961658


Wednesday, December 18, 2019

30-Day Map Challenge

For the month of November, Topi Tjukanov announced a 30 Day Map Challenge on Twitter.
I did not take the time to participate but was amazed at the people who did, many of them every day-and some of the results are pretty fantastic.  I will highlight some of the ones I liked (mostly showing the tweets) though I did not see everything that came along.
For example, here is Lego Oaxaca.
Mangroves vs Hurricanes
European Hydrology
More from Maarten Lambrechts here.

Here is elevation data from the Philippines from Carl Churchill-his other work can be seen on his Flickr album.
https://www.flickr.com/photos/cchurchili/49161902731/in/album-72157712041022003/
New York CityBike data as animated hexagons-press play.
Commuter Rail in the Northeasten USA
London Fried Chicken Territories
and whatever this is.
For more here is a huge gallery of submissions.

Wednesday, December 11, 2019

Jerusalem Over and Under

This month's National Geographic has a remarkable map showing Jerusalem's buildings and sites throughout its many eras of settlement. The fold out map is best seen on paper in the magazine but here is an image of it from Twitter,


and a still frame from the animation above.

The tweet above begins an interesting thread of tweets detailing some of the challenges in creating these graphics. Here is another tweet from that thread showing some of the 3D buildings

One minor issue I have is the size comparison below. While most of us on the east coast of the United States understand this, I'm not sure how meaningful this is to people in other areas of the world.
For bonus content their web page lets you scroll through historical eras to see models of various buildings.
https://www.nationalgeographic.com/history/2019/11/see-centuries-of-architecture-in-jerusalem-feature/


Wednesday, December 4, 2019

Atlas of Boston History

https://pressblog.uchicago.edu/2019/09/12/calling-all-bostonians.html
Via University of Chicago Press
 My wife bought me a copy of the newly published Atlas of Boston History for an anniversary gift. Editor Nancy Seasholes has enlisted a great team of cartographers, historians, planners and even economists to put together a well written and illustrated history. While it is tempting to take photos of some of my personal favorite maps and diagrams, in honor of copyrights I will stick to what is shown on their look inside pages. Sorry for the mediocre image quality.
http://www.atlasofbostonhistory.org/look-inside#pid=1

The book progresses through history so a good start is the geologic setting. The two main colors represent two types of bedrock in the basin, Cambridge Argillite and Roxbury Conglomerate or Puddingstone. The green shapes are drumlins, glacial deposits smoothed into small hills. I really like the diagram below showing the layers of (mostly) glacial deposits from different eras, some from river or undersea deposits and a top layer of where the swamps and bays were filled in. This page also shows buildings and other features made from these rocks.
http://www.atlasofbostonhistory.org/look-inside#pid=1
Here is a map showing the conflicts with the Natives of the area during "King Philip's" War.
http://www.atlasofbostonhistory.org/look-inside#pid=2
Boston in the Revolutionary War era.
http://www.atlasofbostonhistory.org/look-inside#pid=3
Here is a part of a map showing the Abolitionist Movement in the first half of the 1800's.
Some transit maps - the streetcar lines,
http://www.atlasofbostonhistory.org/look-inside#pid=7
and the subway or elevated lines from 1918.
http://www.atlasofbostonhistory.org/look-inside#pid=7
Finally, here is Boston's "racial dot map" for 2010, showing a city with a majority non-white population.
http://www.atlasofbostonhistory.org/look-inside#pid=11
Lots more to see here. A nice holiday gift for the Bostonophile in your life.

Tuesday, November 26, 2019

A Novel Approach to Stepth

There's no such word as stepth but I feel like there should be. Designer Toby Eglesfield was asked to make a map Queenstown in New Zealand for the disabled that would show the approximate steepness of streets. His approach was to use wedges.
https://shapecreative.co.nz/a-map-design-showing-the-steepness-of-streets/
They look a bit like doorstops. Mostly this approach works though I find it a bit confusing when two steep streets intersect like at Sydney Street above. The wedges are color coded by stepth, sorry steepness.
Another nice touch is the use of the same colors for the steepness of walking trails.
The back of the map has the nearby towns of Frankton and Arrowtown-here is Frankton.
https://shapecreative.co.nz/a-map-design-showing-the-steepness-of-streets/
If you focus too much on the elevation wedges it's easy to miss some other nice details like the simple way the services are portrayed and numbered. I also really like the receding tree undersides as if there's a fog coming in off the lake.

Details about Eglesfield's creative process can be seen here.

Wednesday, November 20, 2019

The Bronzeville Map

When I was in Chicago a couple of months ago I made a pilgrimage to the South Side to see the Bronzeville map. This is a bronze relief map created by artist Gregg LeFevre detailing the history of Chicago's African-American community.
I have not been able to find an image of the entire map online so I took pictures of various sections to give a sense of some of the many details. Quoted from the text below the map-the lower left of the image above:
"Depicted here are some of the geographic, cultural and historical features of this area - the “Black Metropolis” of Chicago. In the period after the First World War, an African-American community of vitality and influence developed along these streets. The mixture of people here since the late 19th Century and those drawn here during the Great Migration of the 20th Century produced a new force in Black America: an urban home distinguished for its accomplishments in business, the arts and community life. Particularly notable was a flowering of great music - jazz, blues and gospel - that has enriched American culture from that time forward. Today the Bronzeville legacy lives on in a community that looks with pride to its past and with confidence to its future."
There is a lot to unpack in this map including many maps within the map. Here is a section detailing the railroad history of the Great Migration.
A zoom in on the Illinois Central Railroad map.
A more close-up view shows the bronze relief.
There is a tribute to the many records that came out of this community,
as well as residences of famous musicians, recording studios and clubs. The feet represent walking tour routes.
 On the left below is the Vendome Theatre marquee, on the right is its site.
A tribute to the NAACP and other activist groups.
and a program from a Negro Leagues game between the Chicago American Giants and the New York Cubans-unfortunately I did not get the whole thing in the picture.
Here is the southeast corner of the map with the title block.
Finally, a bit of the lakefront area with my foot stupidly in the picture providing some scale. Nice waves!
The map can be found in the median of Martin Luther King Drive at 35th St.

Wednesday, November 13, 2019

Twenty Foot Japanese Scroll Map

This past summer I took a trip to the Osher Map Library. Among the many wonders I saw there was this 20 foot long scroll map of Japan's Seto Inland Sea.
This is what the map looks like rolled up.
Here are some close-up views. Some of the geography is difficult to reconcile with today's coast but the map appears to be looking westwards from Osaka Bay.
Details include mountains, shrines and navigation routes.


Here is a description of the map on the Osher web page.
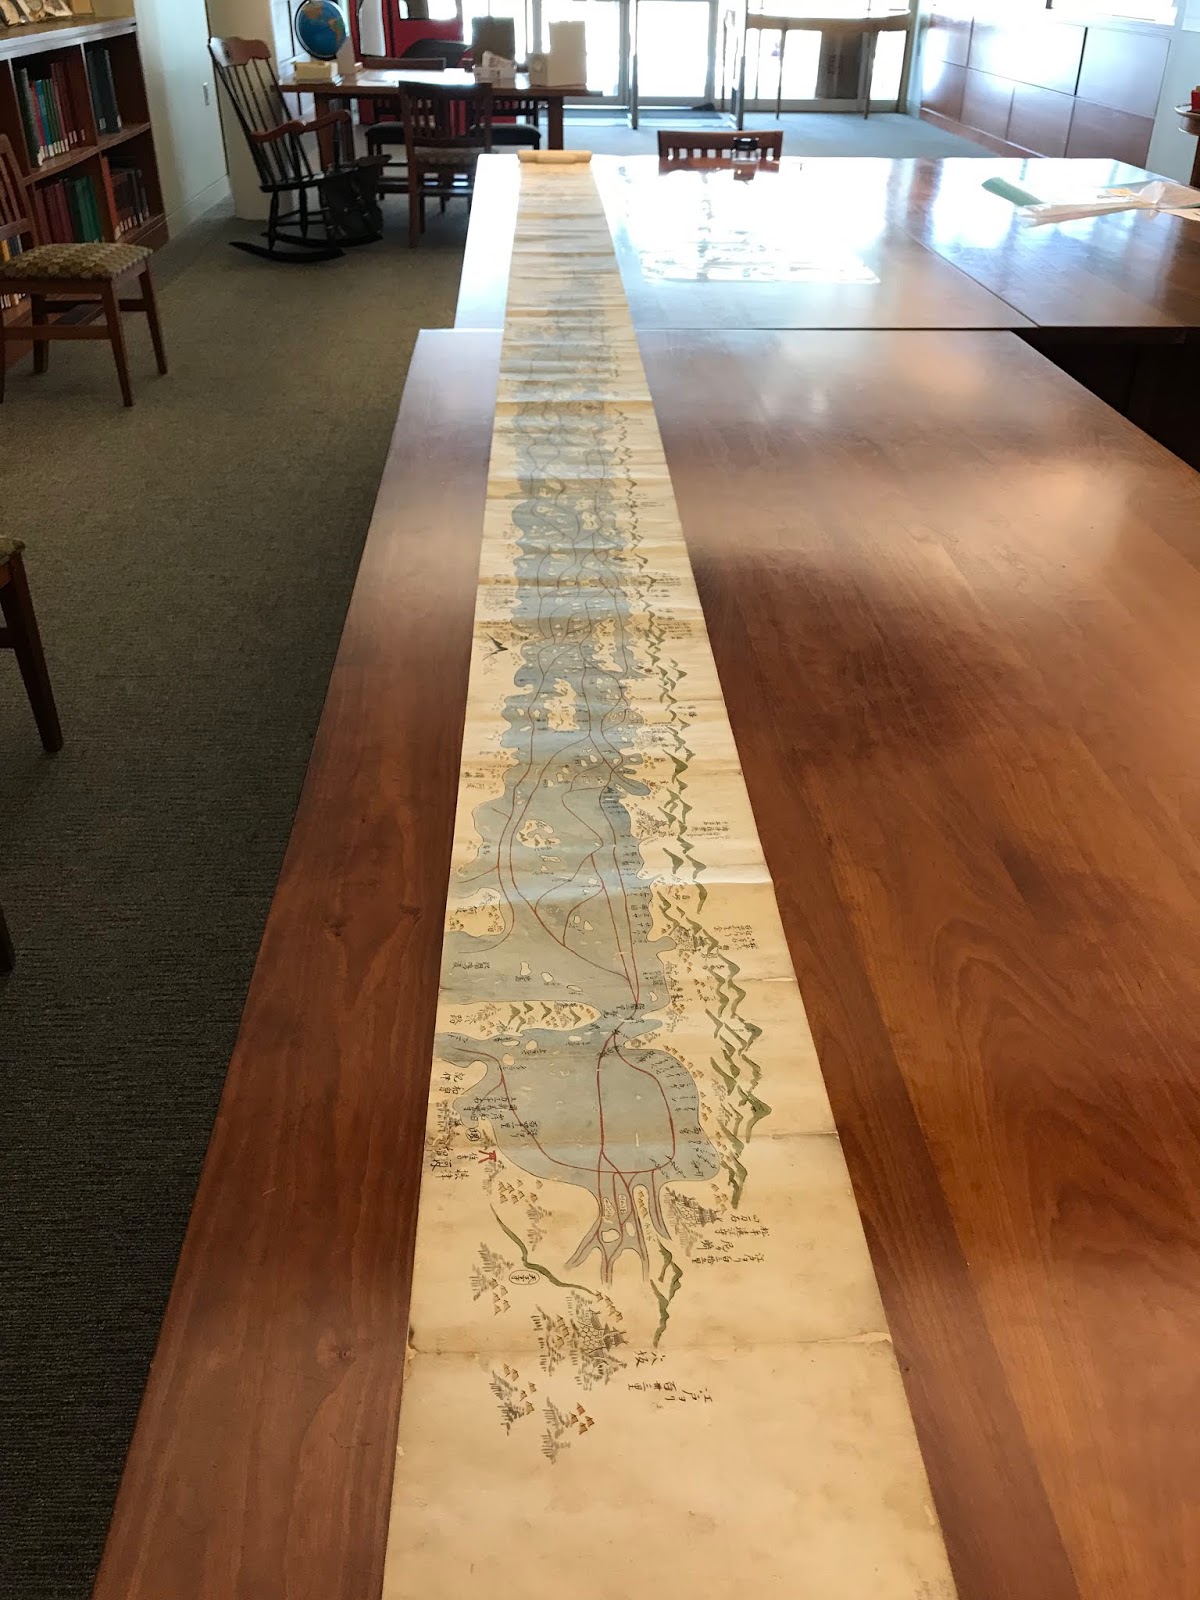
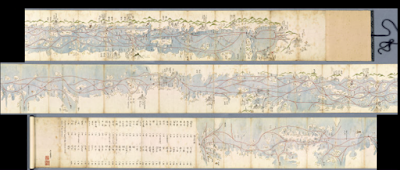
"This Japanese scroll stretches over twenty feet, detailing the coasts and landscapes, castles, shrines and towns. Japanese maps tended to be much larger than European maps of the same era. Many of them were designed to be laid out on wooden floor mats. Created for the purpose of tracking economic activity by region, it notes the annual taxes for each community. It also notes Nagasaki as the only port available to Dutch and Chinese traders. This hand drawn map was crafted in the traditional, pictorial style, known during this period as ezu; the mountains, rolling hills, villages, fortresses, temples, are highly stylized."
The entire map can be browsed here. Here is a view of the entire map in one shot.
https://oshermaps.org/browse-maps?id=17833


Wednesday, November 6, 2019

Boston's Proposed Railway Expansion, 1945

I found this pictorial map on sale as a poster. It's an ambitious expansion plan of the Boston Electric Railway Company from 1945.
https://upload.wikimedia.org/wikipedia/commons/6/6c/1945_BERy_extensions_map.jpg
The map is full of nice pictorial details of station layouts, road configurations and some buildings. Black lines were existing railways, some of which are gone today like the Washington Street elevated line.

Colored lines are proposed extensions, some of them have been built as either subway lines, commuter railroads, or a combination of the two. Here is the Airport-Lynn extension part of which is now the MBTA Blue Line.
Notably not built is the East Watertown-Arlington line that would have stopped a couple blocks from my home. However,  a commuter line did serve the Arlington section as well as Lexington and Bedford. This line gradually declined and was finally knocked out by a snowstorm in 1977. Today it is a bike path.
Not shown is the 1980's extension of the Cambridge Subway, now the Red Line.
Parts of this plan are still being built such as the Green Line extension through Somerville.
This map can be purchased at the MBTA Gift Shop.

Thursday, October 31, 2019

Witches and Ghosts

Here are some maps for your Halloween enjoyment. First, a clickable map of witches in Scotland. This is a map of the Witchcraft Survey Database, a list containing records of all of the recorded accused witches in Scotland from 1563 – 1736. There are maps showing locations of trials, deaths and detentions of accused witches.
The map can be filtered by gender, occupation and social class. You can also change the map for a more historic look.
 This Is Halloween is a project from Jonah Adkins showing locations of the two major pop-up Halloween stores in pink and green with a nice spooky font.
Zoom in and the circle become Pac Man ghosts - spooky!
Finally, Haunted NJ - via Reddit
https://www.reddit.com/r/newjersey/comments/akosf1/haunted_nj_sites/