Showing posts with label map exhibits. Show all posts

Wednesday, September 25, 2019

Highlights from "Mapping a Nation"


This past Saturday I got to see Mapping a Nation: Shaping the Early American Republic at the American Philosophical Society in Philadelphia. The Museum space is small but they packed a lot into that space including maps, surveying instruments, original notes from the Lewis & Clark expedition and printing plates. The introductory text has some interesting takes on the history of the 18th and 19th Centuries describing maps as "battlegrounds" between European empires, Native Americans and colonists. "Even as mapmakers sought to represent a connected and united citizenry, maps reinforced the exclusion of many groups from full participation in the new nation."

Here is a plate from a history of the Lewis & Clark expedition. As usual with these exhibitions, apologies for the light reflections and inability to take better photographs.

A circa 1750 map by John Bartram shows the location of sea shell specimens he collected in the Appalachian Mountains, suggesting that the region was once underwater. He apologizes that the map is "clumsily done, -having neither proper instruments nor convenient time."

Here are a couple of maps of the Susquehanna River area of central Pennsylvania from 1757 originally drawn in chalk by Teedyuscung, a Lenape negotiator during a council in Easton, Pa. where several tribes agreed not to side with the French against the British in return for a promise that the British would not settle west of the Appalachians.

A detail from a map of Maryland and Virginia, 1775.
For credits, here is the cartouche.
There are  a couple of very detailed maps of Haiti during the time of the rebellions around 1799-1801. The United States intervened on behalf of the Haitians in order to protect U.S. trade. Unfortunately I did not make a note of the map's author or date.
The area around Jacmel where much of the fighting took place.
Finally, "Map of the Columbia to illustrate Ross's Adventures" just because I like the little singular puffy mountains.

The exhibit runs until December 29th and includes a three day conference in October.

Thursday, March 29, 2018

Landmarks: Maps as Literary Illustration

On Tuesday I got a chance to see an exhibit at Harvard University's Houghton Library called Landmarks: Maps as Literary Illustration. There was a great talk by illustrator and Cinemaps author Andrew DeGraff (whose own work is worthy of a future blog post) followed by a tour of the gallery. I hope to get back to share more before the exhibit closes (April 14th-soon!) but for now here are a couple of crude pictures I took with my phone. The description cards are mostly legible. Maybe I can get better pictures on a future visit.

Here are some Dell Mapbacks - more about Mapbacks here.
Finally, a Nancy Drew mystery.


Wednesday, August 10, 2016

Pictorial Maps-a more detailed review

Last week I visited the Osher Map Library where The Golden Age of American Pictorial Maps runs through September 3rd. I did a very short blog post. Now that I have more time here are some more detailed highlights. Most of the exhibit's maps can be seen and zoomed into online at this link. I took my own pictures to give a detailed look at parts of the maps and also to make the text more readable

The "Golden Age" of American pictorial maps is defined as the 1920's-1960's, a time when maps were part of and a reflection of the popular culture.  There are seven parts to the exhibit - I will try and show highlights from each in order.


1. Early Pictorial Maps
The first map in the collection is actually not from this time period - it is from a 1662 Joan Blaeu world atlas.  The point is to illustrate an early version of a map with many pictorial elements.

http://oshermaps.org/map/458
After touring the exhibit, I got a chance to hold a volume of this atlas in my hands. The atlas is full of great details that I hope to revisit in a future post.

George Walker & Co., Bird's Eye View from Summit Mt. Washington (ca. 1905)
http://oshermaps.org/map/40687
 This is a spectacular art/map combination. Here's a picture I took of the summit.

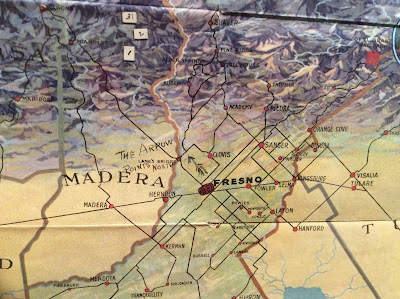
Fresno County and Mid-California's "Garden of the Sun" (author anonymous) is another one of my favorites:
http://oshermaps.org/map/4000155
Also in this section is the London Wonderground Map  that was the subject of a previous Map of the Week post.


2. Maps of Place and Region

Ilonka Karasz, Plan de Paris (1927)
http://oshermaps.org/map/4000160
Of course I love Paris but I also love the way the streets have hatch lines that make it look like they were stitched onto the map.

Carl Crow and V. V. Kovalsky Illustrated Historical Map of Shanghai (1935)
I liked the title block so I photographed it.
http://oshermaps.org/map/4000187

3. Maps to Instruct

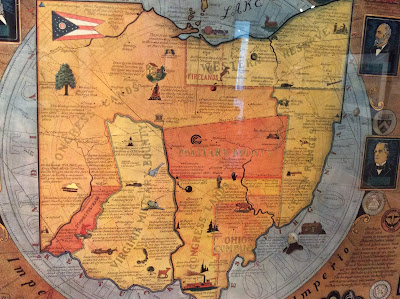
Arthur B. Suchy Ohio, Mother of Presidents (1939)
http://oshermaps.org/map/4000162
The regions are interesting and new to me-lots of good small details too.
Emma Bourne, America-A Nation of One People From Many Countries (1940)
http://oshermaps.org/map/4000182
This was published by the Council Against Intolerance in America to show how well immigrants have been integrated into society. "With the exception of the Indian all Americans or their forefathers came here from other countries." While I was at this exhibit, Donald Trump was across town trying to blame Maine's Somali immigrants for an imaginary rise in crime.

 Edward Everett Henry, The Virginian (1960)

a remarkably detailed map illustrating the first "western" novel.

4. Maps to Amuse
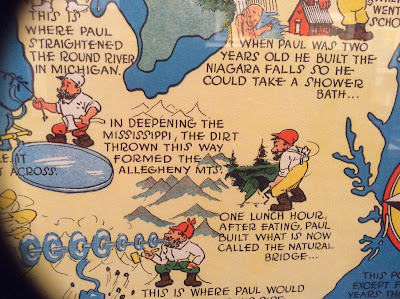
Ray Handy's Paul Bunyan map is some good, ridiculous fun.
http://oshermaps.org/map/4000166

Also, similar to my old Texan's map postcard is this Angeleno-centric "brag map"- proudly showing off local geographic ignorance. Chicago is a state but Wisconsin a mere city within Minnesota.  States are placed in ridiculous locations with a giant Iowa in the middle and phony places like "Feudville" in Kentucky.
http://oshermaps.org/map/4000146
5. Maps for Industry

Cleveland Terminal Group, The Capital of a New Trade Empire (1929)
Civic pride on steroids! I chose this one because my wife could find the intersection where she once lived on the map-it's right there in the lower right - see it?

Map of Michigan (Slightly Exaggerated) Shafer's Bakeries, Inc. (1949)
Similar to the LA "brag map" but also advertising bread ("such crust!") and using loaves as border decorations. Nice references to Florida as "Southern Michigan," California as "Western Michigan" and Chicago as the "Gateway to Michigan."

6. Maps for War.
 Ernest Dudley Chase, Japan, The Target: A Pictorial Jap Map (1943)
http://oshermaps.org/map/4000173
World War 2 in the North Sea Area...(1944)
http://oshermaps.org/map/4000171
This one was in a big glass display in the center of the room. As a result I was not able to get a picture without lots of reflections so use the link to see it better.

7. Maps for Postwar America.

There are lots of good maps in this collection, but I like this juxtaposition of an optimistic map of New York from 1958 followed by a gloomy view of LA from a decade later. The LA view features pink sky, smog and a sickly sun.

Nils Hansell, Wonders of New York (ca 1958)
http://oshermaps.org/map/4000176
Gene Holtan, Los Angeles (1968)
http://oshermaps.org/map/4000177
One final note: The staff at the Osher Library were extremely welcoming and helpful. Mr. Osher even dropped in to see what I was doing. I would like to thank them for all their help - and the lunch recommendation!

Thursday, August 4, 2016

The Golden Age of American Pictorial Maps

 Today I am posting live from the Osher Map Library where The Golden Age of American Pictorial Maps runs through September 3rd. I planned to do a "live blog" but this exhibition has greatly exceeded my expectations. In order to do it justice, I will need to do a more thorough post when I have the time. In the meanwhile here are some highlights. Here is the Buckminster Fuller Dymaxion Projection on the side of the building
Projected Global Air Routes- link
Rio-World's most beautiful (and maybe polluted) harbor. Site of tomorrow's Olympics
On the trail of Moby Dick-link
Dystopian LA with its Pepto-Bismol Sky-link
Also, they let handle an Atlas by Joan Blaeu!
More on that and everything else later.   

Wednesday, February 3, 2016

Oldest Aboriginal Map of New Zealand

Unfolding the Map, a celebration of the cartography of New Zealand, is on exhibit at the National Library of New Zealand in Wellington. One of the featured maps is a reproduction of Tuki's Map, the oldest known Māori map of New Zealand.
http://natlib.govt.nz/records/22866321
The original map was drawn by Tuki Te Terenui Whare Pirau, a Māori who was captured and imprisoned on Norfolk Island. The map on display is a reproduction drawn by the New Zealand Department of Internal Affairs (circa 1940). The original was circa 1793. Tuki made this map for the lieutenant governor of Norfolk Island who was interested in his language culture.

Tuki was from the peninsula north of Auckland in the far northern part of the North Island. This area is greatly exaggerated in size and detail. He knew little of the much larger South Island so it is drawn as a small island at the bottom.

Bonus Map!
Another nice map from the exhibit is this lighthouse chart from 1900.
http://natlib.govt.nz/records/21624539
Here is the legend and a detailed view.

Unfolding the Map "brings together the fascinating maps of the Library's collections and stunning examples of the state of the art today." The exhibit is on display through August, 2016. If you're in the area check it out.
http://natlib.govt.nz/visiting/wellington/unfolding-the-map


Wednesday, January 27, 2016

Women in Cartography

Women in Cartography is an excellent exhibition at the Boston Public Library. It runs until March 27th. If you don't get a chance to visit in person you can view the exhibition online here. In December I got a chance to see it. Here are some of the highlights.

Physiographic Diagram of the Western Pacific Ocean - Marie Tharp and Bruce Heezen, 1971
Geologist/Cartographer Marie Tharp created the first map of the ocean floor. Originally this map was credited solely to Heezen, her research partner. It is displayed on the floor. Here is a picture I took looking down.
The numbers indicate depths of the sea bottom and height of undersea mountains. The colored areas are land, in this case the Hawaiian Islands rising from the depths of the Pacific.

Mappemonde Projetée sur l’Horizon d’Angers - Céleste Babin, 1839
This double hemisphere map was done by a student in Angers, France. The left hemisphere is centered on Angers and the right one on its antipode (opposite side of the earth.)
http://maps.bpl.org/id/19872
The detail below shows off some nice hand calligraphy and a view from Angers.
A General Map of North America …  - Mary Ann Rocque, 1761
Rocque carried on her husband's business after his death. This map was credited to "M.A. Rocque" obscuring (possibly intentionally) that it was produced by a woman.  
http://maps.bpl.org/id/12086

A New Map of ye Seat of War in Italy - Ann Lea and Robert Morden, 1701
Ann Lea also took over her husband's map business after his death. The map shows areas of northern Italy that were fought over between France and the Austrian Empire before Italian unification.
http://maps.bpl.org/id/15340

“Nationalities Map No. 1,” from Hull-House Maps and Papers … - Agnes Sinclair Holbrook, 1895
http://maps.bpl.org/id/19878
Hull House was a settlement house for female immigrants in Chicago. Holbrook, a house resident designed the map based on Charles Booth's income maps of London (previously mentioned in this post about my visit to Chicago's Newberry Library.) Other house residents helped her gather data for the neighborhood.
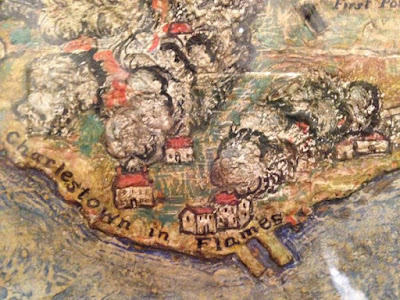
The Attack on Bunker Hill in the Peninsula of Charlestown the 17th of June 1775 - Mildred Giddings Burrage, 1926 
Burrage was a Maine-based artist. She created this map/scene using layers of Gesso to build up a sense of topography.
http://maps.bpl.org/id/19957

The exhibit concludes with a technology section including the following maps.

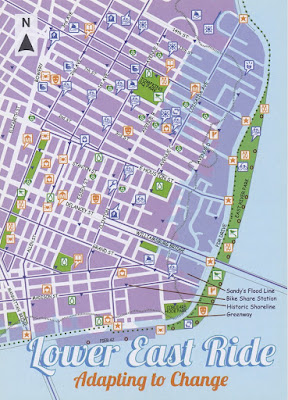
Lower East Ride: Adapting to Change - Maryam Khabazi, Designer, 2013
Created by Green Map NYC, this map highlights the impact of climate change and natural disasters such as Superstorm Sandy and shows resources to reduce energy consumption.
http://www.bpl.org/exhibitions/current-exhibitions/women-in-cartography/view-the-exhibition/women-in-cartography-33/


Making History - GIS and Women - Linda Loubert, PhD - 2014-
Dr. Loubert built this crowd-sourced webmap to document thousands of women working in the field of GIS.
http://arcg.is/1UE8onH
You can see the entire online map here or by clicking the image above. I know some of these people! GIS women rock!