Wednesday, April 25, 2018

Canadian Checkerboard - Part 1

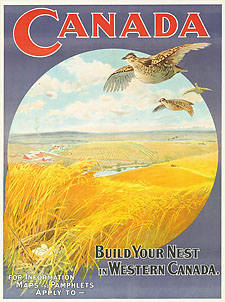
In the past year I've accumulated dozens of maps. A friend had grandparents who tried homesteading on the Canadian Prairies and gave me some remarkable maps showing lands that were available via the Dominion Lands Act. Here is a 1917 map showing lands in Manitoba, Saskatchewan and Alberta.
The map is 3 ft x 2 ft. I was able to scan it at a high resolution. Here are some readable details.

The Dominion Lands Act of 1872 was based on the Homestead Act in the United States. Square shaped 160-acre parcels of land (much of it taken from indigenous tribes without compensation) were made available to settlers in return for a small registration fee. They had to establish farms and build permanent dwellings in return. Immigrants from Europe were encouraged to settle on these lands, partially out of fear of the United States (where most of the good land had been taken by then) trying to lay claim to them. Some of the land was set aside for soldiers.
http://www.collectionscanada.gc.ca/obj/021017/f1/c126302k-v3.jpg

Red numbers indicate the number of quarter sections available in each 6 x 6 mile township. The green area is Palliser's Traingle, an arid region where exemptions were made so farmers could buy adjacent lots and double the size of their homesteads, increasing their chances at successful agriculture.  Railroad companies owned the land within 20 miles of their tracks so townships adjacent to the tracks had no numbers while nearby ones had smaller numbers. Here is the legend.
I'm not sure what part of the act was discontinued or what "O. in C." refers to.

For contrast here is a more sparse area along the Peace River in northern Alberta.
I have more of these maps and will show them in another post or two. Stay tuned!

Wednesday, April 18, 2018

The Maps of Thoreau

Henry David Thoreau is mainly known for nature writing, but he was also an accomplished surveyor and cartographer. Here is a detail from an 1853 Concord, Massachusetts farm survey. Note the north arrows and the name of one of the abutting landowners "N. Hawthorne."
https://placesjournal.org/wp-content/uploads/2018/03/miller-9-thoreau.jpg
An excellent article by Daegan Miller in Places Journal (source of the image above) details his involvement in disputes between farmers and industrialists over the water levels of the Concord River. He carefully surveyed the river, noting depths, fords, sandbars and bridges with some interesting written embellishments such as "here is a shallow place", "quick current", "willow", "bottom soft", etc.

The article has a nice detail from a 91 inch wide rolled survey of the river. Unfortunately I cannot show it here because of permissions issues but you can see it from the web page of the Concord Free Library. One important takeaway is that through his notes on the map Thoreau sought to bring life to the map by filling details into the empty spaces. Previous maps had treated the river as a resource to be plundered. To quote Miller
"all those notes pinpointing where the plants grew, all those piles of figures and ghosts of surveys past, make of Thoreau’s a deep map — a view of an impressively interconnected world where nature, commerce, culture, history, and imagination all grow together — something nonfungible and specific: a full, a wild land living at once beyond and beneath the confined landscape of the town’s grasping improvers, both agricultural and industrial, who, despite their superficial differences, ultimately agreed that the best use of a river is to turn a profit."
Thoreau mapped many of the places he traveled to such as Cape Cod - via OpenCulture,
http://cdn8.openculture.com/wp-content/uploads/2013/10/HDT_Cape_Cod_large.jpg
and the Merrimack River in New Hampshire via Mapping Thoreau Country.
You can see a huge collection of his maps a surveys via the Concord Free Library's Thoreau Surveys page. Most are farm surveys from Massachusetts but there are also plans for industrial sites as well as copies of historic maps of North America.

Thursday, April 12, 2018

What is a Milk Run and Y

Y do all the major airport codes in Canada begin with a Y? This map, via They Draw and Travel, partially explains. It also tells you what a "milk run" was. Click for a readable version.
https://static.theydrawandcook.com/uploads/travel/illustrations/images/5945/standard/Milk_Run_Canada_Map.jpg.jpg?1429017235
Here's a map of the weather stations across Canada with all the Y codes, and a couple of Z codes too.
http://www.novaweather.net/cdn_sta_code.jpg


Wednesday, April 11, 2018

Soundscapes

"The Soundscape of Istanbul project (https://soundscapeofistanbul.ku.edu.tr) approaches everyday traditions and daily urban life from a sonic perspective and aims to increase public awareness of cultural sounds."
http://www.soundsslike.com
The dots above are color coded by type of space and a click on each one brings up a window with a SoundCloud sample of what the place sounds like. Here is an English translation of the legend for those of us who can't read Turkish.
The colors could be more logical and it is difficult to distinguish some of them on the map. 

There are three other cities including Diyarbakir in southeastern Turkey, where you can listen to the sounds of the tailor and copper smith among others. You can create a nice orchestral cacophony by clicking on a bunch of sounds.
http://diyarbakir.soundsslike.com
Also included are London with traffic noises, train announcements, church bells and street musicians,
and Le Havre, France, where you can listen to maritime traffic and the blessing of the ships.
The project has a platform where you can register a login and contribute your own sounds.

Wednesday, April 4, 2018

The Riots in Washington DC

Fifty years ago, on April 4th, 1968, after the assassination of Dr. Martin Luther King Jr., Washington D. C. erupted with several days of rioting. The Washington Post has an excellent story with pictures videos and maps. Here is an animated map showing incidents as reported by the Secret Service.
This map shows the overall amount of destruction. I altered the original image slightly to show the legend.
https://www.washingtonpost.com/graphics/2018/local/dc-riots-1968/?utm_term=.f1da7e1f8f1e
Here are the two maps above overlaid.
There are also a few detailed maps of the major corridors where destruction took place showing individual buildings using the same color code. This one shows 7th St NW.
Here is a tweet from Lauren Tierney, Graphics Reporter at the Post about the design process. The color scheme replicates the original map.
Also, one for the north arrow.