Wednesday, May 31, 2023

US Oil and Gas Pipelines

Felt is a nice web mapping app that anyone can use to get a map and add your own data, mark it up and share with others. One of their most interesting example maps is this map of oil and gas pipelines

Oil pipelines are in blue and natural gas is orange. I would have reversed that color scheme but I didn't make the map. Interesting to see some pockets of activity. Look at all this gas infrastructure under the Gulf of Mexico,

or this major center of both kinds of activity in Eastern Oklahoma.

The shaded areas are "tight oil and shale gas plays". I'm not familiar with the terminology but it's basically fracking as far as I can tell.


 You can explore the entire map here.


Wednesday, May 24, 2023

The Incredible Shrinking Great Salt Lake(s)

NOTE: due to accidental deletions on this platform I have lost some of the original attributions for this post.

Here is a map of the paleo-lakes of the Great Basin from the Pleistocene Era.

The present day lakes are shown in lighter blue though even those have shrunk from the outlines shown above. These water bodies are endorheic,  meaning their water is retained-they do not drain to any external bodies of water. Among the many large lakes is Lake Bonneville, whose remnants include the Great Salt Lake and Utah Lake. Bonneville had many levels or shorelines formed during periods of rising and falling water levels.

About 18,000 years ago Lake Bonneville reached its highest elevation and began to overflow into the Snake River basin in southern Idaho. The overflow became a massive catastrophic flood that drained a huge amount of the lake's water away, possibly in less than a year. Post-flood the lake receded to the Provo level, shown in light blue on the above map or the dark blue area on this (probably colored from the original) US Geological Survey map from 1890.

This image, via Wikipedia, shows what some of the different past shorelines look like on an aerial view.

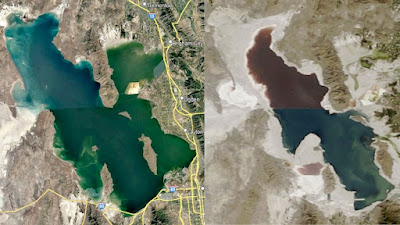
Recently as the climate has warmed these lakes, like many others in desert climates have shrunk quite a bit. Although a typical map of Utah shows this outline for the Great Salt Lake,

the real water level is now what is shown on the right below. Utah just had an unusually snowy winter so the levels have probably risen, but the long term trend of shrinking is likely to continue.

Image via Utah State University


Wednesday, May 17, 2023

The Alphabet Railway

Radio personality Bill Barry was fascinated with the place names of his native Saskatchewan. So much so that he wrote a Dictionary of Saskatchewan Place Names, I'm sure you've probably read it already but an interesting item about this toponymy is how many of the towns were originally named by the powerful railway companies. The Grand Trunk Pacific Railway began naming its sidings in alphabetical order starting in Manitoba and going through the alphabet three times. Here is part of a map from Barry's book, via the Prairie Fiddler. Click to see the entire map.

You can still see the pattern in today's place names. Here's a section via Apple Maps going from Venn to Zelma then continuing with Allan, Bradwell and Clavet.

Their are interruptions for pre-existing towns or other anomalies such as Nokomis but otherwise it follows pretty well. Here is a detail of the above section from an old RandMcNally map showing a place called Xena between Watrous and Young.

Wednesday, May 10, 2023

Make the Desert Bloom

 Tomas Pueyo has an idea to help combat global warming and rising seas. His idea is to create new seas by flooding several below sea level basins, such as the Dead Sea or Death Valley with seawater to create or enlarge inland seas. Here is an image from his Substack pages showing how Egypt's Qattara Depression could be flooded to create a sea. This image was cropped to better fit the format of this page.

Because the depression is below sea level pipelines from the sea can generate electricity while bringing water in from the Mediterranean Sea. This electricity could be used to desalinate some of the sea water and pump that water into a reservoir. 

The article discusses how the Mediterranean Sea was similar to the Dead Sea during the Messinian Salinity Crisis. The sea level was very low and the basin was very hot, dry and salty. This period ended with the Zanclean Flood when the Straits of Gibraltar were breached and the Atlantic Ocean emptied huge quantities of water into the basin. The rising sea levels made the climate of the surrounding areas wetter and cooler and resulted in a large increase in vegetation. Eventually a thriving ecosystem formed and the suggestion is that creating new seas would have a similar effect. Here are some suggested locations where new seas could be created. Once again, I have altered the original image, breaking it into hemispheres for readability.

Israel and Jordan have both considered doing this for the Dead Sea. International political issues have gotten in the way but most of these other candidates don't involve international borders so they could be more easily done. There is much more to read about this process in Uncharted Territories.


Wednesday, May 3, 2023

The Hidden Logic of Cities

The Beautiful Hidden Logic of Cities by Erin Davis shows the streets of various cities in the United States color coded by suffix - (street, road, avenue, etc). 

From where I've lived there seemed to be a clear logic to streets, avenues, boulevards and others. In my mind minor city streets are streets, avenues are wide long arteries and boulevards are even wider, often with a median. Roads are suburban versions of avenues while drives, ways and lanes are suburban versions of streets (except in northwest Philadelphia where lanes are strangely like avenues). However it turns out that other cities have a very different arrangement. Where I live now there are tiny streets called "avenues"-that just seems wrong to me! The example above from Chicago shows that outside of the downtown areas most of the north-south streets are avenues while the east-west streets alternate between streets and avenues. 

Cleveland In 50 Maps shows a clear logic there-all avenues run east-west while streets run north-south. The Buffalo book shows how avenues tend to be further out from the city center, named in a later time period to sound fashionable. This example from the Detroit book is closer to my understanding.

The Hidden Logic project shows examples of various cities and has a Github link where you can make a map of your favorite area. I have not had a chance to try this out yet. This detail of Manhattan from the New York map shows how as settlement moved northwards, a regular pattern of north-south avenues (blue) and east-west streets (yellow) developed. Across the river in Queens the pattern is reversed.

Houston is pretty much all streets until you get out by the beltway.

Many suburbs take an anything goes approach to naming. Enjoy this crazy quilt of names in Miami Lakes, Florida.