Thursday, March 1, 2007

MOTW #67

Snobs like me who order loose tea from catalogs get newsletters like the Upton Tea Quarterly. They have articles about the history of tea. This history mirrors the history of empires controlling trade. The current issue has this map on the cover showing the eastern Portuguese Empire.

Some quotes from the article:

"Portugal was the fist country to establish an empire upon which the sun never set"

Vasco da Gama set the tone of "hatred and vengeance which would characterize Portuguese-Muslim relations for the future. By 1504 the Pope received a threat that Christian holy places would be destroyed unless something was done to curb the Portuguese".

The empire started modestly with the claiming of unoccupied islands such as Madiera and Porto Santo. Prince Henry "The Navigator" claimed to have liberated these places from Muslim rule.

Thursday, February 22, 2007

MOTW #66

This is a map from 1987-88 showing areas suitable for growing Cocoa in the Rio Cobre Valley of Jamaica. The map illustrates what we cartographers had to deal with in the early days of computer maps - a small set of ugly and hard to read shading patterns. The map is remarkably usable considering that. If you zoom in on the image you can actually tell the areas apart and match them to the legend.
Suitability for Cocoa growing was determined by overlaying population density, roads, soils, slope of land, rainfall and temperature. This map was displayed by ESRI to show off the magic of this new technology called GIS.

Thursday, February 15, 2007

MOTW #65

For a very different take on mapping look at the Marshall Islands. They construct "stick charts" that emphasize ocean swells as much or more than geographic locations. Click the image and the page shows some examples and gives you more information about them.

Thursday, February 8, 2007

MOTW #64

Watch counties evolve across the USA with this cool animation.

Thursday, February 1, 2007

MOTW #63

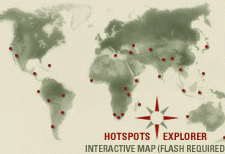
Here is an interactive map of Biodiversity Hotspots published by Conservation International.
Click on an area to get maps, photos, statistics and a boatload of other worthwhile information.

Thursday, January 25, 2007

MOTW #62


This map is from the Immigration Portal - their description follows:
The map above reflects the number of donations received by possibly the largest anti-immigration organization in its 2006 year-end fundraising campaign (source: NumbersUSA). We observe two points from this map (the map represents House
Districts, hence it is controlled for population). Firstly, the
map shows that anti-immigration sentiment is not prevalent across the country but is regionalized, with the West and Southwest more anti-immigrant (red, orange, and yellow shaded areas) and the East, Midwest, and most of the South more pro-immigrant (gray, purple, green, and blue shaded areas). Perhaps because of the
fact that the Southwest is a hotbed of the anti-immigrationists, prominent politicians of that area (Gov. Schwarzennegger, Sen.McCain, and Rep. Flake) support legalization. They grasp that the
problem is not immigrants but their legal status. Secondly, the red parts in the map correlate well with areas of recent Mexican immigration. To the extent that these immigrants assimilate, we should expect this map to cool in the future. On the other hand, if tensions between recent migrants and natives remain, we should expect the cooler areas to heat up as immigration to these areas increases in the future.

Thursday, January 18, 2007

MOTW #61

The Philadelphia Inquirer published a really good map showing 2006 murders in the city. If you click the map below you can go to the interactive map. Click on any dot to get details about the crime - victim, race, time , weapon, etc. You can also use these as filters to see only daytime murders or murders by "hand". Keep in mind that this a an entire year 's worth of data and in most of the city murder is really not that common an occurrence. Really we have lots of nice neighborhoods! I'm serious!