Wednesday, June 8, 2016

Imperial Russian Trading Cards

The Mid-19th Century Russian Empire was so large that it covered over 15% of the world's land area. It included a huge mix of ethnic, linguistic and religious groups. One way to show their imperial pride was to create sets of cards representing their many provinces. Here is Lifland Province (Latvia)
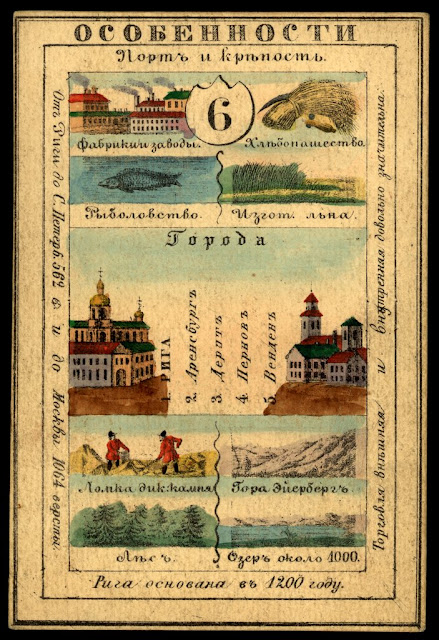
These cards listed principal cities, agricultural and industrial products. They also show coats of arms and local clothing styles. On the back side was usually a map.
The cards are from the National Library of Russia and The World Digital Library has put images of them online. They can be browsed from an interactive map that also has an overlay of a map of the Empire from 1827-the approximate time period of the cards. Click on the numbers to see the cards.
For example, Kamchatka
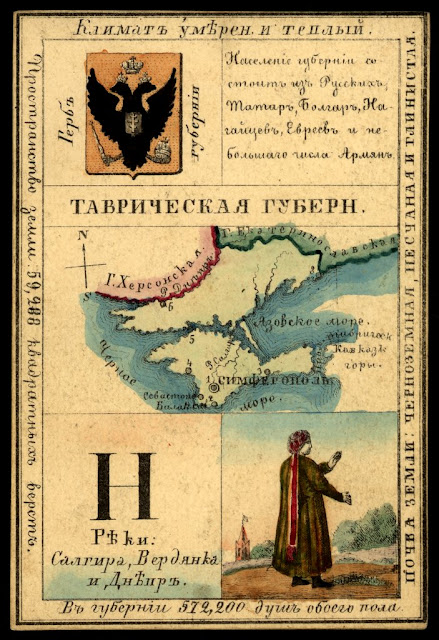
Here is Tavrich (Taurida) Province, including Crimea claimed then as it is again now by the Russians.
https://www.wdl.org/en/item/746/view/1/1/

https://www.wdl.org/en/item/746/view/1/1/
To browse the map. for more cards click here.

Wednesday, June 1, 2016

Moving Pictures

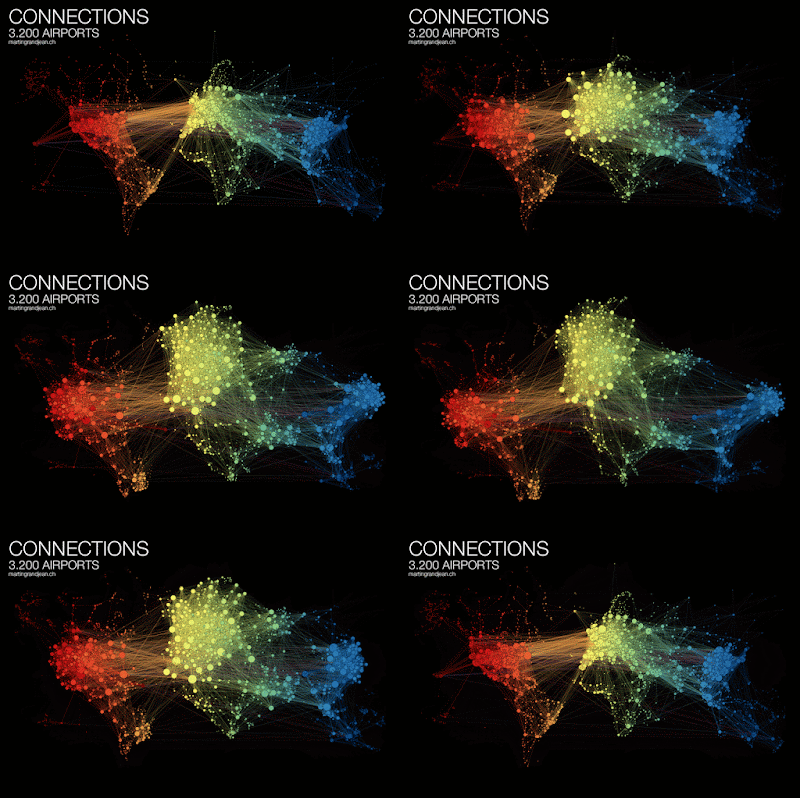
Martin Grandjean shows the network of air traffic patterns with an animation that loops between a purely geographic view and a force directed layout. This network view expands the busy areas such as Europe so you can see individual airports where they are tightly clustered.
http://www.martingrandjean.ch/connected-world-air-traffic-network/
Colors are arranged by longitude to help untangle the network - and also make it pretty. The network view is also arranged to visualize clusters where travel connections are more frequent. His observations about these clusters are interesting:
"India is more connected to the Middle East than to South and East Asia. The Russian cluster is very visible, connecting airports in Russia but also in many former Soviet republics. Latin america is clearly divided between a South cluster and a Central American cluster very connected with the U.S."
More information about this visualization and larger versions of the maps can be found here.

Mark Evans created visualizations of commutes to every county in the United States from ACS (US Census) data.
Non-blue dots represent the most common four counties that commuters come from, while the blue dots are other common locations. ACS data is aggregated by census tracts or block groups so the to and from locations are generalized. His blog post explains.

I find it interesting to compare the density of jobs among cities. This comparison of Houston and San Francisco gives a good idea of the differing transportation needs in those cities.
Here are screen shots of the final work destinations. You can explore your own favorite places here.


Tuesday, May 24, 2016

Lady Anne Blunt in Northern Arabia

In March the Library of Congress posted a series of maps for Women's History Month on their geography and map blog. Their last post was a map showing the journeys of Lady Anne Blunt through northern Arabia.
https://blogs.loc.gov/maps/2016/03/lady-anne-blunt/
Blunt was a British noblewoman who was famous for helping to save the purebred Arabian horse by buying and bringing horses to England. She was the first European woman to cross the Arabian desert in pursuit of these horses. As an interesting side note her mother, Ada King-Noel, Countess of Lovelace is often regarded as the first computer programmer.

Blunt was not a cartographer but her place-specific descriptions of two journeys, in 1878 and 1879, allowed Edward Stanford, a London bookseller and mapmaker (creator of Stanfords Travel Guides) to create this remarkably detailed map.  It shows not just the physical geography of the land, but cultural features such as irrigation and grazing practices, tribal relations and pilgrimage routes.
Here are a couple more zoomed in views.

You can browse and/or download the entire map online at the Library of Congress.

Wednesday, May 18, 2016

Spaces We Love

The American Institute of Architects 2016 Conference opens this week in Philadelphia. The local chapter has put together Spaces We Love - a series of videos in which 11 residents were asked to describe their favorite spaces in the city. This seems like a project in need of a map so I decided to take it on as a learning experience for the CartodB platform. You can interact with it (click the black AIA logos for info and videos) below or see it in full screen here.

Friday, May 13, 2016

Tastes of Sweden

A couple of months ago I featured the Flavors of Finland, a map/recipe mashup from Expedia. Now here's the Tastes of Sweden.

Taste of Sweden by ExpediaSE


The traditional provinces are all represented. From their outreach message:
 Due to Sweden's large North–South expanse, the variations between the local recipes and dishes are quite huge, and this piece enables you to explore these on a local level. What is even more special about the piece is the fact that it draws attention to both infamous and lesser known dishes and their rich histories so that in many ways it doubles up as both a test of our local culinary knowledge, and also a really cool education piece because we can click around the map in order to learn about each and every dish – including the likes of the Southern spit cake, salmon spring rolls from Västergötland, hare burgers from Medelpad, and even a lovely reindeer stew from Lappland.
Here is a lovely screen shot in case of page load problems

Tuesday, May 10, 2016

MIT's Innovation District

Last week the Boston Globe had a clever map of "The Kendall Network"  I posted it on Twitter but have not had a chance to mention it here. It accompanies an article celebrating the 100th anniversary of MIT's move from Boston to an empty warehouse district of Cambridge. For those unfamiliar with Boston, Kendall Square is the area adjacent to MIT and has recently seen a huge growth in tech companies.
http://www.bostonglobe.com/specials/2016/05/05/mapping-kendall-square-network/whKpe5VayFBBJJD8tsUMWP/igraphic.html
The printed circuit board analogy works great because of the somewhat ordinary (by local standards) street network. If this was Harvard, it would have been much more difficult to make this kind of map. The crazy Harvard Square street network there would have required some major schematic simplification. The Kendall Square area only needed minor adjustments. MIT is the chip that is driving the innovation around it. Nice work Globe graphics team!

Wednesday, May 4, 2016

Mapping the Pitches

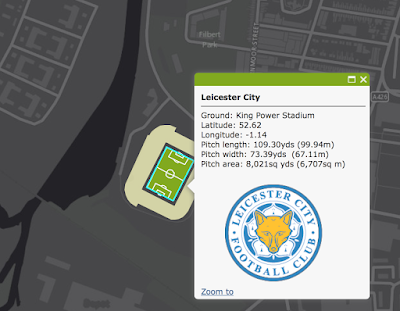
Cartographer and (Nottingham) Forest fan Kenneth Field recently mapped 92 Football Association (UK) pitches.  In honor of Leicester City's extremely improbable Premier League title (congrats!) here is King Power Stadium.
http://carto.maps.arcgis.com/apps/webappviewer/index.html?id=b159a7936f9742f6a5e5a4723af80d1c
Each pitch is set against a stark grey background to emphasize the field details.
http://carto.maps.arcgis.com/apps/webappviewer/index.html?id=b159a7936f9742f6a5e5a4723af80d1c
 You can pan and zoom around Great Britain or choose a team from the list.
Personally, I like Norwich because I always seem to back the hard luck teams. Plus I like canaries.
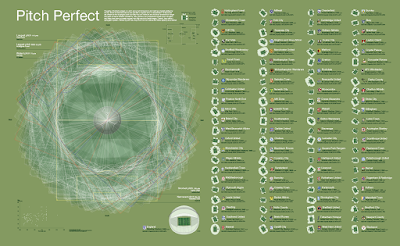
There is also a poster with all the pitches overlaid to show the subtle differences in dimensions and orientations. The dimensions are specified by the football associations, yet there are still subtle differences in the length and width of each pitch. 
http://carto.maps.arcgis.com/home/item.html?id=7d4dabb9a71c44aabdcf3d4444e451d4
From the poster text:
Overlaid, they create a spirographic pattern. Ranked by pitch size, they show how clean stature and stadia capacity are unrelated.