Wednesday, January 30, 2019

Renaming Confederate Avenue(s)

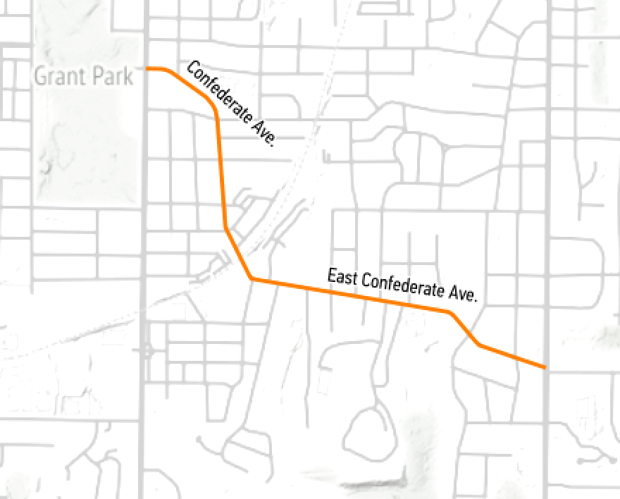
Last week the City of Atlanta renamed Confederate and East Confederate Avenue to United Avenue. They also renamed a small street, Confederate Court as Trestletree Court.
https://cdn.theatlantic.com/assets/media/img/posts/2018/09/Screenshot_2018_09_25_17.01.11/cbcdac3ff.png

Google and Apple Maps both responded quickly with the new names.


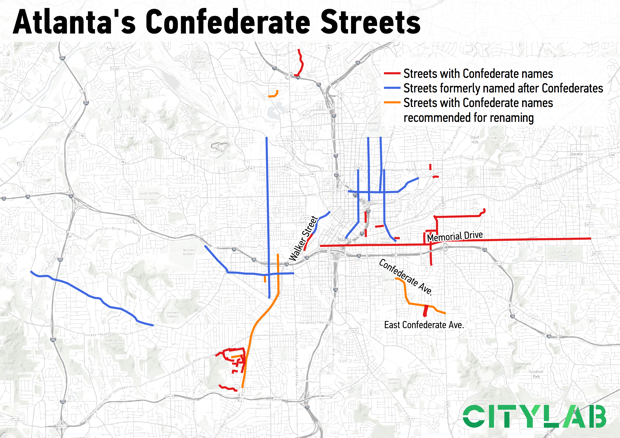
Over the years several streets with names honoring Confederate or Klan leaders have been changed. An article in CityLab includes this map showing streets that have been renamed in blue, recommended renamings in orange and other streets with Confederate names.
https://cdn.theatlantic.com/assets/media/img/posts/2018/09/confederate_names/f111126c0.png
Renaming streets is expensive and can be controversial. From CityLab:
 "The proposal must be reviewed by the city’s urban design commission, then its public works department, then the utilities committee, and finally the city council. If you want to suggest naming a street after a living person, that person has to be at least 75 years old (No, Bobby Brown Parkway is not named after the King of R&B). Just to get started, the application fee is $2,500, which is compounded by the costs to the city for replacing the street signs if approved. Which is, yes, expensive."
Also not mentioned are the costs to the residents and businesses for stationery, signs and other change of address inconveniences. Along Confederate Avenue most residents wanted to rename the street. In the future the city will look into much thornier renaming situations. Streets like Walker and Bell have less obvious associations but they are also named for Confederate leaders.


Wednesday, January 23, 2019

The Cost of Water

I found this map created by the Los Angeles Bureau of Power and Light in 1922 via the Cornell University Library's Persuasive Maps collection.
https://digital.library.cornell.edu/catalog/ss:19343636
It appeared on the back of an electric bill and was meant to explain the cost of water. There is a chart of water rates comparing LA favorably to other cities. I like the title "Why Not Free Water? Because of the Cost." It does a good job of breaking down the costs of the 250-mile aqueduct and distribution system.

I stumbled across the map above while looking for the one below. It appeared in some marketing materials and makes a nice modern contrast to the Cost of Water map. It is a different era but the water issues are even more urgent.
https://www.nycwatershed.org/about-us/overview/croton-catskilldelaware-watersheds/
New York City's water system delivers over a billion gallons of water each day to 9 million residents. The length of the aqueducts and reach of the system is impressive - 1,972 square miles of drainage systems flowing into an aqueduct that crosses the Hudson River. That's a lot of cost for water- think about that next time you leave the faucet running.

Wednesday, January 16, 2019

The Costs of War

This map via Smithsonian Magazine shows much* of the breadth of US military and government anti terrorist actions.
https://thumbs-prod.si-cdn.com/DepQcE5siDEClK1OMDdPaFRimKo=/1072x720/filters:no_upscale()/https://public-media.si-cdn.com/filer/76/45/7645fe6c-a982-4828-bdff-7043074884b2/counterterrorismmapweb.png
The map was developed by Brown University's Costs of War Project. Since the image is a bit blurry when zoomed in, here is a detail from their web page,
and also an enlarged legend.
 "We found that, contrary to what most Americans believe, the war on terror is not winding down—it has spread to more than 40 percent of the world’s countries."

Read more at: Smithsonian and even more at the Costs of War Project
  
* as stated in the article "U.S. efforts to combat terrorism abroad are likely more extensive than this map shows."

Thursday, January 10, 2019

The Great Molasses Explosion

January 15th will mark the 100th anniversary of the Great Molasses Flood. In Boston's North End, a tank filled with molasses burst sending a wave of molasses up to 25 feet high through the streets at 35 miles per hour and knocking buildings off their foundations.

Here is a simulation on YouTube of the flow. User ingomar200 factored in topography, building heights and the size of the tank to create this. He shows the velocity contours later in the video.
This is from a 1917 Bromley Atlas showing the area-via the Boston Planning & Development Agency.
Molasses was used in the manufacture of munitions, The tank is the blue circle. It was conveniently located near the docks and next to the elevated railway that was partially destroyed by flowing molasses. The tank was constructed in haste and inadequately.

21 people and many horses were killed. Some city blocks were flooded to a depth of 2-3 feet. Cleanup of the area took weeks and the harbor was brown for months. Victims brought a successful class action suit against the owners who tried to use fear of terrorism to avoid punishment, claiming that anarchists had placed dynamite in the tank.

Here is the Boston Globe from January 16, 1919 - via the Boston Public Library's flickr page.
and their diagram of the area.
 https://www.flickr.com/photos/boston_public_library/4901511527/in/album-72157624622085789/

Wednesday, January 2, 2019

Geopolitical Map Genres to be Vigilant of in 2019

This excellent Twitter thread by Steven Seegel, author of Map Men is a good way to start a new year. Rather than show all 11 tweets, I will post some highlights. You can see the whole thread by clicking on the first tweet below.

Here's a map I posted without considering its possible implications of "problematic" populations.


Tuesday, December 18, 2018

What They Drop on New Year's Eve

I made  a map of objects that are dropped on New Year's Eve. It is based on this Wikipedia page. Click for a more readable version 
The density of points in Pennsylvania made it necessary for two inset maps - one focused just on the Harrisburg area, the center of dropping things according to Wikipedia. The high density of points in various locations made this an obvious candidate for an interactive map, so I created one - click the image below to see it. You can zoom in and click on an object to see the town or city and what the object is as that is not always clear. Beware - sometimes the interactive map does not load all points on the first try. If only a few appear, refresh the page.
https://douggreenfield.github.io/NewYearsEve/Newyre.html
Here is a zoomed in view of Harrisburg.
The static map was made mostly using QGIS, the interactive map is via Leaflet using a basemap from CARTO.
Notes about the data on the map
The Wikipedia page that was the source for this map is subject to changes at any time and may have already changed since this map was created. Some of the items listed on that page were either one time events or have been discontinued. These were not included on the map. There are two locations outside of the United States (Bermuda and Canada) that were not included but may be added at a later time. There is an obvious Pennsylvania bias in the results as much of this came from an article in Penn Live - this is also where I first saw some of these and got the idea for the map. See map notes below for how this was handled cartographically.
Mapping Notes
Most points are from canned US cities data sets and are not accurate when zoomed in too far. The locations reference cities or towns and are not meant to represent precise locations of the towns or drop events. In some cases they may be several miles away. The Key West locations were moved slightly so both objects would be readable. There are (at this time, December, 2018) no objects listed in Alaska or Hawaii. This allowed me to zoom the map in and not need the inset maps commonly seen for these states. Instead, I was able to use those spaces for Pennsylvania, which has such dense data that it needed two separate insets, one just focused on Harrisburg. A couple of other areas, particularly northern Georgia are also very dense. The interactive version was created for this problem.

Wednesday, December 12, 2018

Rabbit Proof Fence

Rabbits were introduced to Australia in 1859 by English settler Thomas Austin. According to Austin "The introduction of a few rabbits could do little harm and might provide a touch of home, in addition to a spot of hunting." The rabbit population quickly exploded and caused major damage to crops and pastureland. Staring in 1901 a 1,139 mile fence was built across western Australia to keep the rabbits from migrating from the east.
http://pandora.nla.gov.au/pan/43156/20040709-0000/agspsrv34.agric.wa.gov.au/programs/app/barrier/maps/pages/Rabbitproofmap_jpg.htm

An earlier fence proposal was ridiculed in this cartoon.
https://en.wikipedia.org/wiki/Rabbit-proof_fence#/media/File:StateLibQld_1_197791_Stevenson%27s_wire_fence.jpg
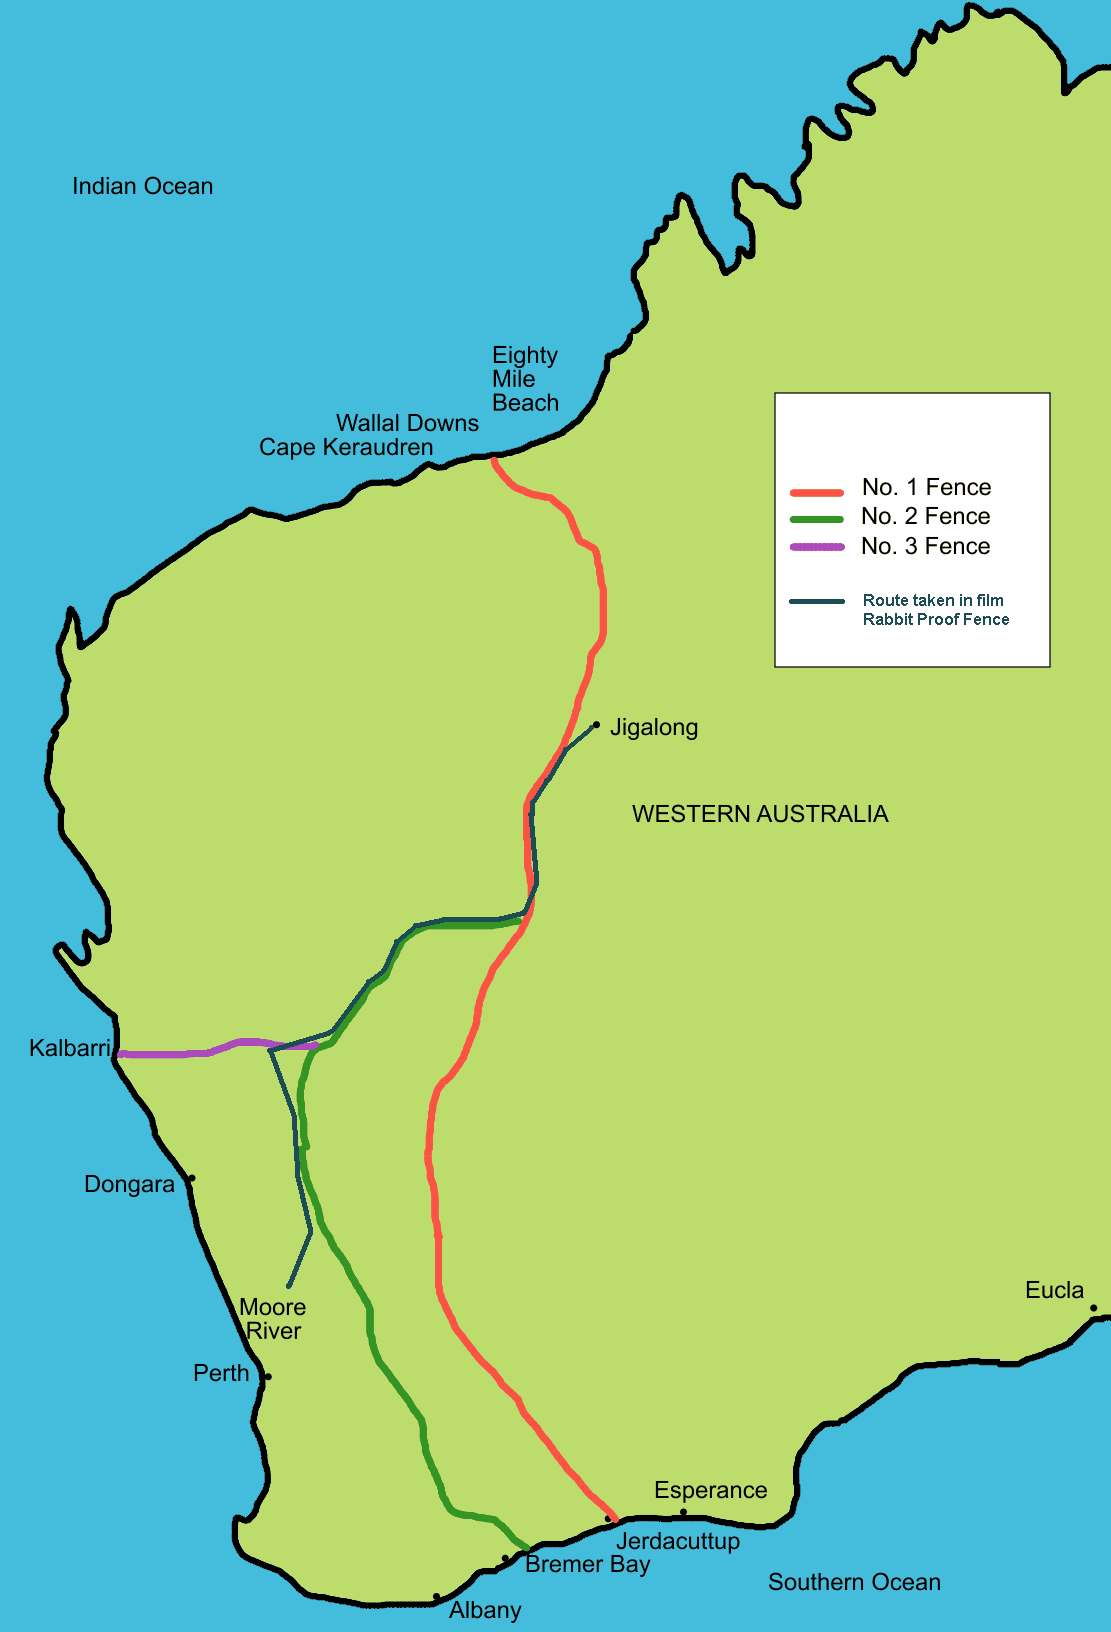
The first fence is the one furthest to the east. It was the largest unbroken fence in the world. Unfortunately rabbits were found west of the original line so a second and then third fence were constructed. By 1907 2,023 miles (3,256 kilometers) of fence were built. This map, via Wikipedia, has each section color coded.
https://upload.wikimedia.org/wikipedia/commons/6/64/Rabbit_proof_fence_map_showing_route.PNG
In the 1930's the fence was used as an escape route for three young indigenous girls back home from a settlement camp near Perth where they had been taken by force. Their route is shown in black above and and the story is recounted in the book Follow the Rabbit-Proof Fence.

Today, much of the shortest fence route still stands (as seen on the map below from 2001) as the State Barrier Fence of Western Australia.  It is used to control emus, wild dogs and feral goats and also serves as a fire break and disease barrier for various animals.
http://pandora.nla.gov.au/pan/43156/20040709-0000/agspsrv34.agric.wa.gov.au/programs/app/barrier/maps/images/fence3.jpg