Thursday, October 19, 2023

The Real World Costs of Bitcoin

 This is from April but at last week’s NACIS conference I saw Zach Levitt speak about making these graphics for the New York Times. The story details how in the midst of a winter storm that left tens or thousands without power, bitcoin mines in the state kept running, until the companies were finally paid handsomely to shut down operations. One company was paid $18 million over four days for not operating, at the expense of the state’s taxpayers.

Here is a map showing the largest power users in Texas.

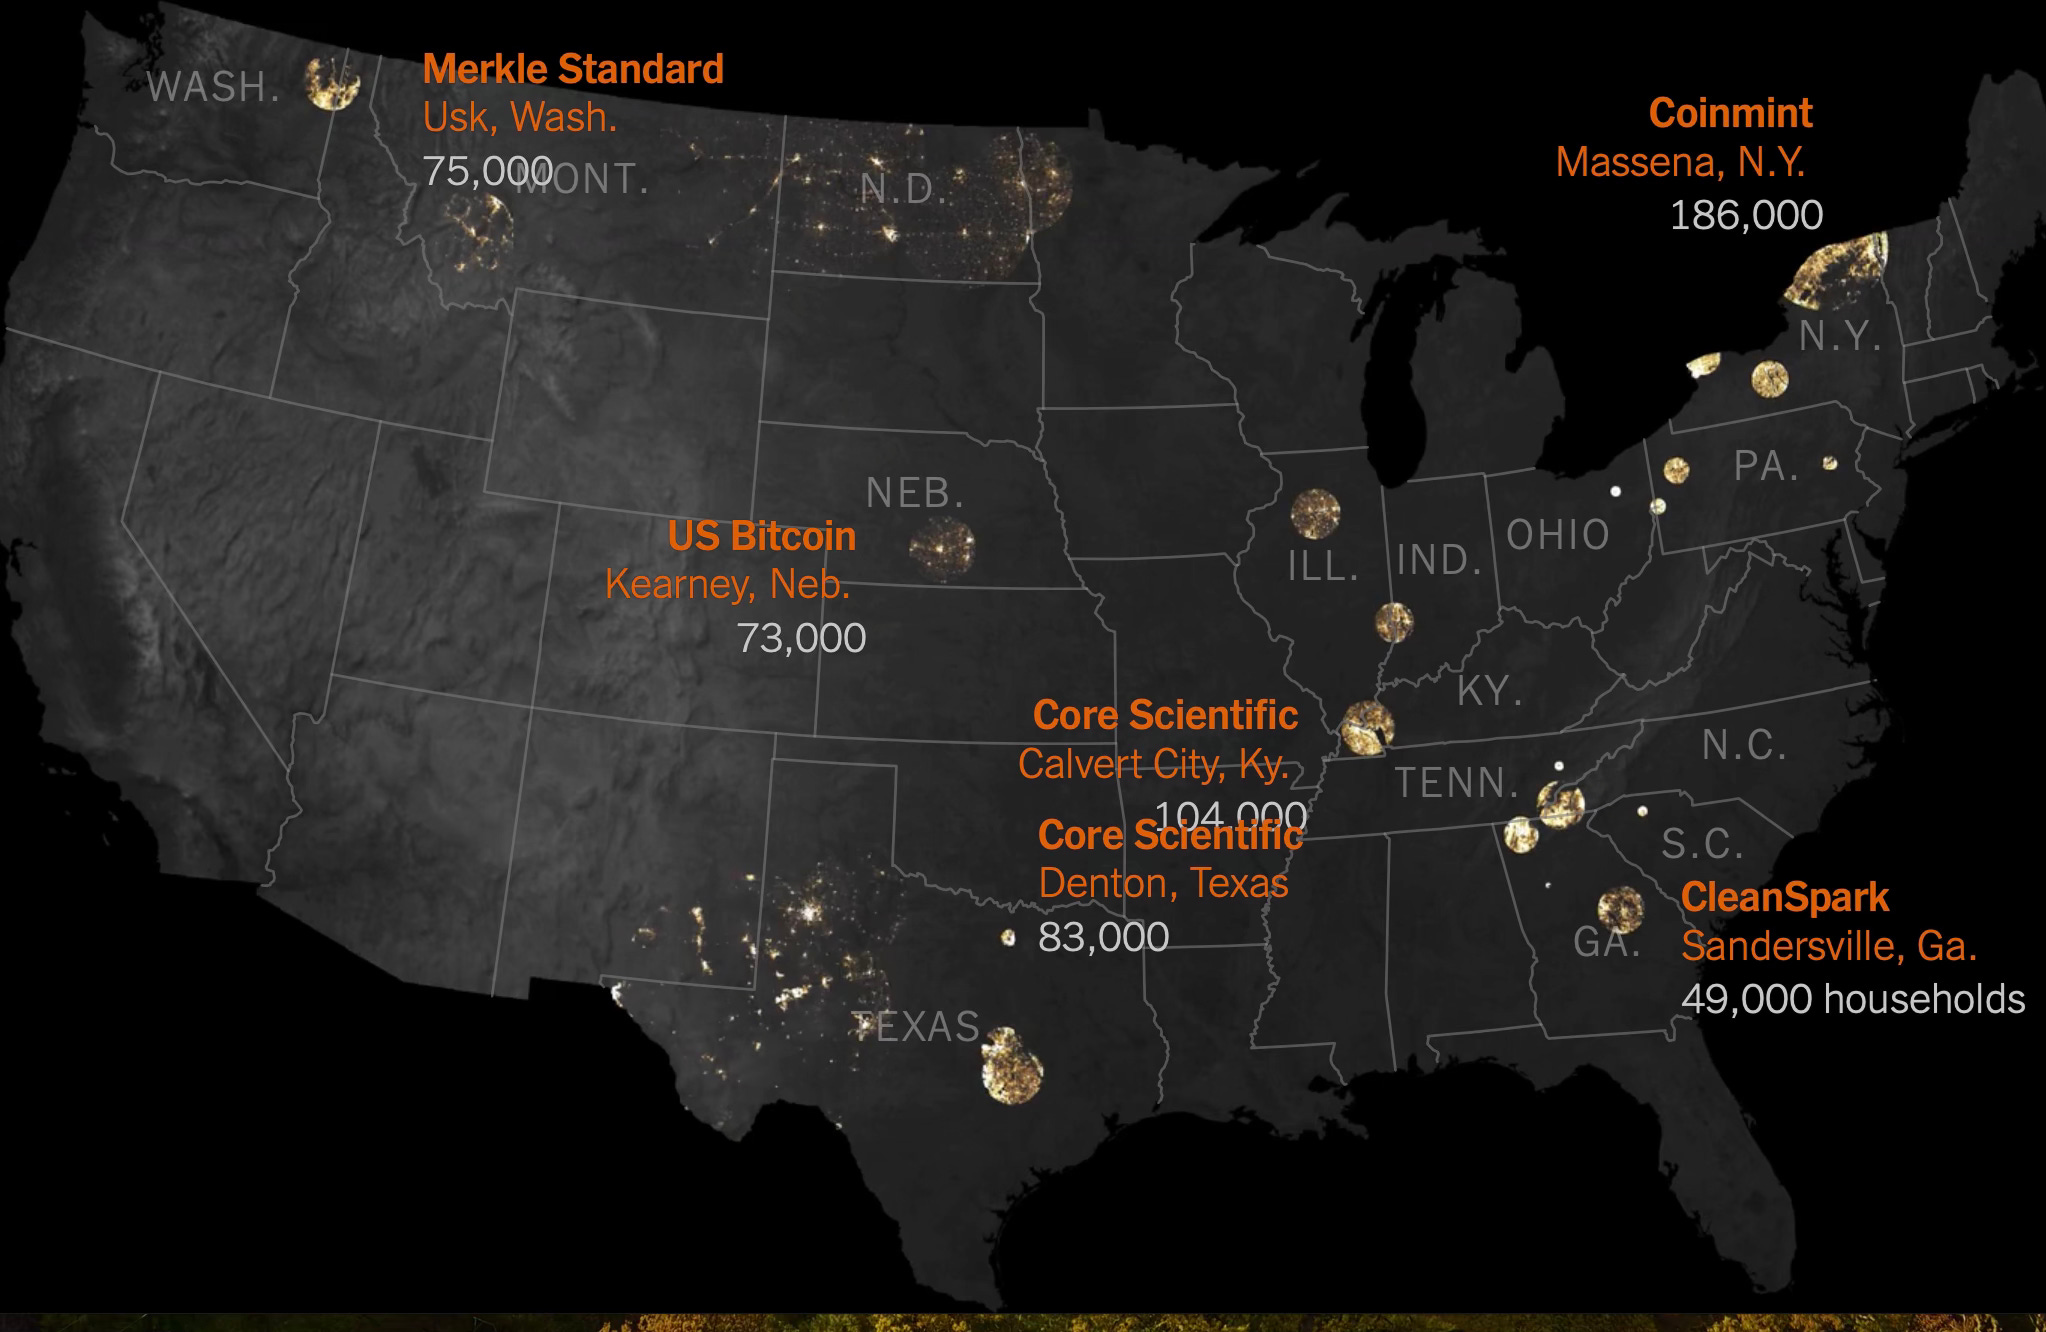
Bitcoin mines can use as much power as small cities do, with computers continuously refreshing their algorithms. China drove out bitcoin mines a few years ago because of their power usage but they have found a welcome home in many U.S. States.

Here is a map showing the number of households that use equivalent power to the nearby mines. 
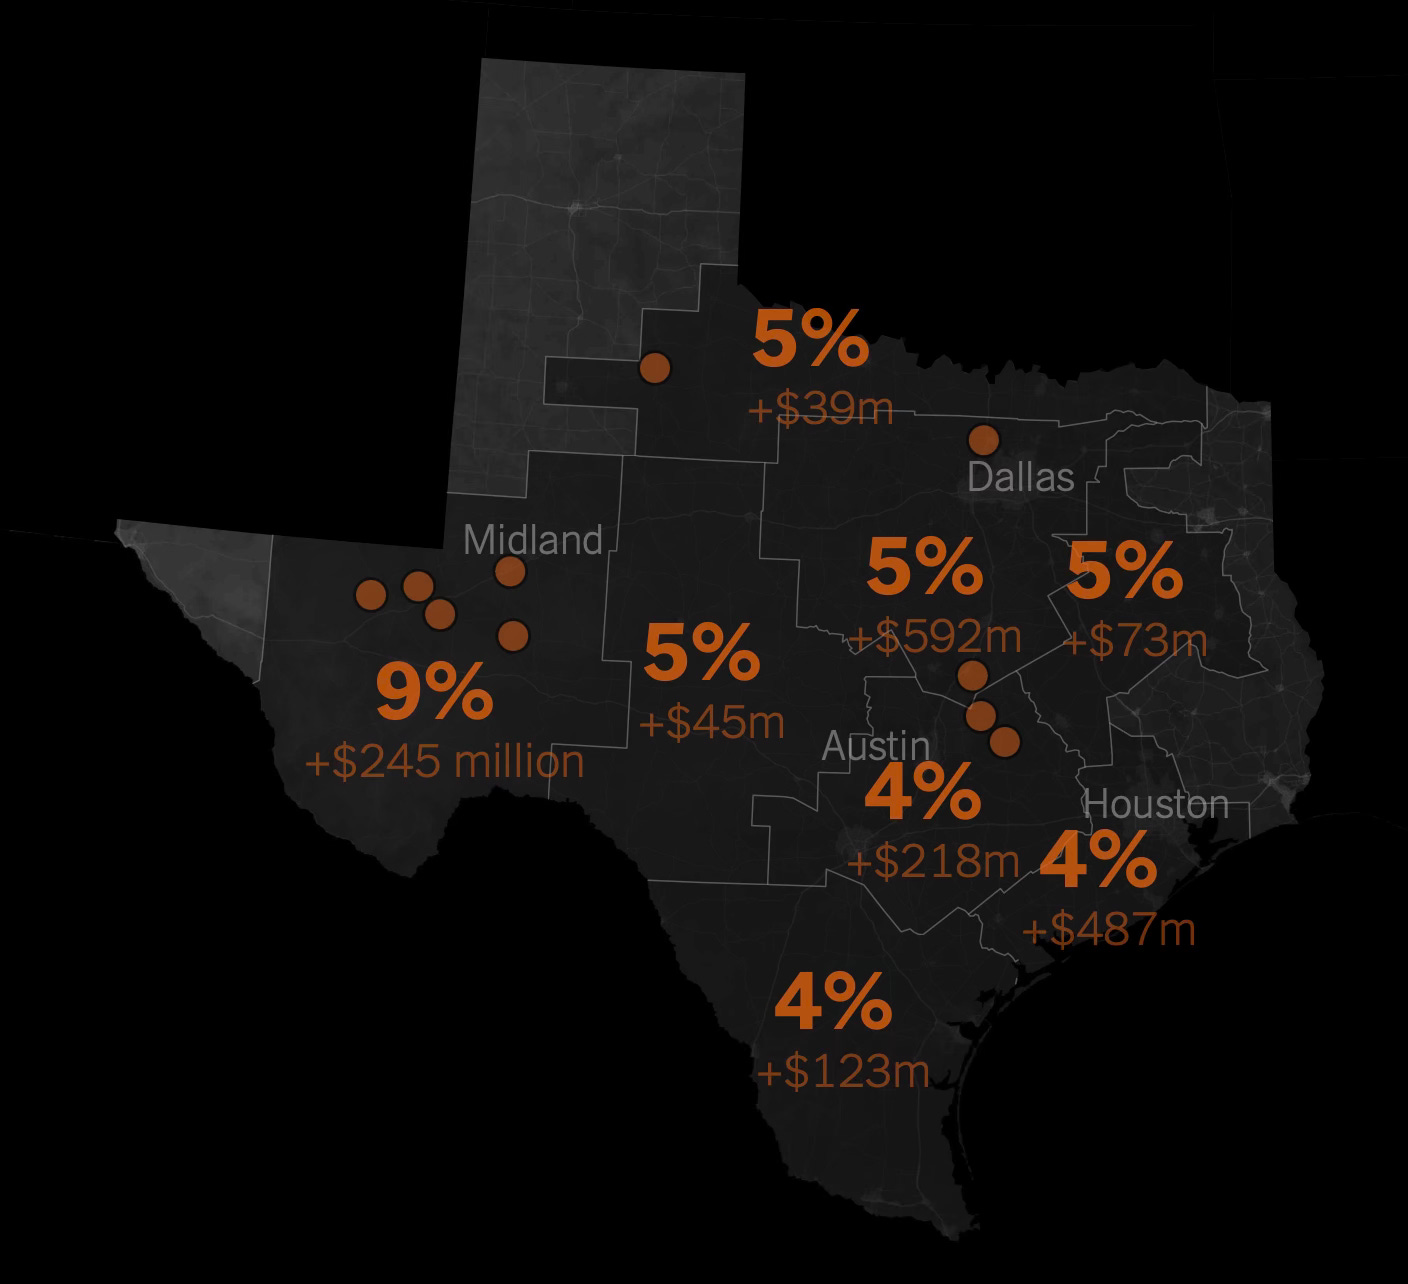
In Texas local energy bills have gone up significantly.
Bitcoin defenders tout the jobs they are bringing to rural areas but while Ethereum, another cryptocurrency reduced their electricity use by 99 percent, Bitcoin has refused to change their algorithm. The heavy power usage is keeping us reliant on fossil fuels, greatly hindering our abilities to reach our climate and pollution goals. The whole story can be seen here.

Thursday, October 12, 2023

Pittsburgh Week

This week I am attending the North American Cartographic Information Society (NACIS) meeting in Pittsburgh so I haven't had time for a proper blog post. There's lots of great stuff here that may make for future blog posts but in the meantime here are a few random maps I've come across.

Here is a map of the original Fort Pitt, located on its site at Point State Park. The park and fort remains are located at the confluence of the three rivers (really two rivers coming together) and the location just feels  important. This is a look out from the point with another map in the ground, looking out at the newly formed Ohio River,

and a view from above on Mount Washington.

I got up and down Mount Washington via the two remaining incline railroads. Here is the busiest part of a map hanging at the incline station of all the historic inclines.

I took number 2 up and number 4 back down, the rest are gone.

Finally, a NACIS tradition is the quilt - using maps various members create of the host city, pieced together.


Wednesday, October 4, 2023

Seoul Maps

I found this nice collection of maps of Seoul, South Korea's largest city and capital from theSEOULlive. This is a website/magazine of Korean culture that "focuses on unraveling the hidden jewels of Seoul that can only be found with rumination." 

Unfortunately these maps are shown at a fairly low resolution so the details are hard to read. The maps vary from the purely pictorial,

to themed maps such as "Literature",

 "Mountain",

a map of medical facilities titled "Cure",

"Night",

and this schematic map with the river straightened out highlighting urban farming.

There is no easy link to the entire collection but you can browse them by clicking the Seoul Map dropdown at the top of theSEOULlive page and choosing the entries for 2017-2020.


Friday, September 29, 2023

Mid 1900's Urban Planning in Philadelphia

Here are a few urban planning items to close out Philadelphia month. Hope you have enjoyed the journey.

Cathedral Road:

There are many discontinued highways and roads to nowhere throughout the United States, including Woodhaven Road, a dead end expressway in Northeast Philadelphia. Cathedral Road was planned as a major four lane highway connecting the affluent areas of Chestnut Hill and Bryn Mawr across large parts of Northwest Philadelphia and across the Wissahickon Creek. 

via Hidden City

While this is mainly a local story (extensively documented in Hidden City), I find it interesting to see a four lane, empty tree lined highway on Google Street View,

eventually ending at the woods.

images via Google

Here is an overall plan of the area via Hidden City

Mid-century city planner Edmund Bacon was one of the era's primary visionaries though some of his early projects were more beneficial to suburban commuters than to city residents. Here is a picture of his 3D model of the city.

via Philadelphia Inquirer

Bacon believed in a top down approach to planning. As an antidote, University of Pennsylvania professor and landscape architect Ian McHarg advocated for a nature based approach to planning. His book Design With Nature influenced many future planners including me in college. He was also an early pioneer in the idea of creating overlays (showing natural features such as soils and aquifers underneath the built environment), one of the foundations of GIS.  Here is a piece of a very large map he created with his students showing the area's geology under the city's grid.

via WHYY Philadelphia

More on McHarg here.
Thursday, September 28, 2023

Philadelphia Bookstore Map

Note: As September comes to a close so does Philadelphia month. There will be a couple more posts today and tomorrow before I return to my normal weekly schedule.

This one is personal. Several years ago I was working with a Philly-based computer programmer and an artist to create a map of bookstores in Philadelphia. We put together lists, artwork and I made a few mock up maps but we never got much interest from the store owners. Apparently someone else did because the Philadelphia Bookstore Map is now a reality. A creation of artist Henry Crane (I don't know him) and the booksellers (unlike us he got them to buy into the project), the map succeeds pretty well while incorporating some similar artwork to what we were going for-images of the stores and some local sites.

As a disclaimer, I have not yet seen the paper copy, only what is available on the web page and on Instagram. It looks like there is an inset map (not shown online) of the stores on South Street, a good way of the solving the density problem we also faced.

A few minor points of criticism. I would have muted the background map to make the points stand out more though he could have also done that using bolder point colors. I'm not a big fan of the overly Google-looking teardrop shapes but they work fine here. The colors for different categories of stores could also be more distinct. 

One of the best things about this is that in the online version there is a page to access sub-pages for each store by clicking on the bookstore drawings.

I chose this image of Bindlestiff Books because that is one of the stores we visited on our journey. One last nice detail - he used one of my favorite Rittenhouse Square statues from my childhood, Billy the goat on the cover.

via Instagram


Wednesday, September 27, 2023

Innovation in Segregation

Before the Home Owners' Loan Corporation (HOLC) redlining maps encouraged segregation (documented extensively including on this blog), there was this 1934 map by property analyst J. M. Brewer. It showed real estate conditions in Philadelphia with a wary eye towards immigrants, Jews and people of color and provided a model for the HOLC maps and accompanying practices of real estate segregation.

via Greater Philadelphia GeoHistory Network

The legend shows concerns about certain groups and their effects on the neighborhoods,

and the "quality" of local businesses.

There is a note at the bottom of the legend saying "All location ratings and racial concentration quotes are the opinion only of J.M. Brewer after careful investigation of the location."

Here is the South Philly neighborhood where my family lived at the time. They were in a transition zone between the predominantly Jewish and Italian areas. The neighborhood grades are generally D and E (Decadent!), while the business blocks range from third to fifth class.

Here is a neighborhood north of downtown where some of my family had previously lived, much of this area is now part of Temple University.

Later in her life my grandmother moved to an "A" neighborhood near Rittenhouse Square. Nice area but look out for that scary red "E" blocks just to the south!

Brewer consulted with the HOLC on their 1937 map of Philadelphia, where the prejudicial language became more obvious with map notes such as "Infiltration of Jewish into area have depressed values". These maps were used to deny mortgages to people in "hazardous" areas, generally immigrant and minority neighborhoods, making home ownership almost impossible to most residents of these areas. The resulting inability to grow wealth and stabilize neighborhoods has effects that have persisted ever since.


Thursday, September 21, 2023

Hidden Hydrology

In my day job I've mapped buried streams to give an indication of areas that are most likely to flood in major storms. It turns out that buried streams in older urban centers is common everywhere. Hidden Hydrology is a great resource for exploring disappeared waterways throughout the country. I stumbled across their extensive PhillyH2O page. Here are some maps, from the extensive Water History PHL site.

The map below shows just how few of the original streams (in blue) remain and shows the sewers that have replaced these streams in red.
 

An inset from the Lenapehoking Map, mentioned last week also does an artistic job of showing these same waterways.

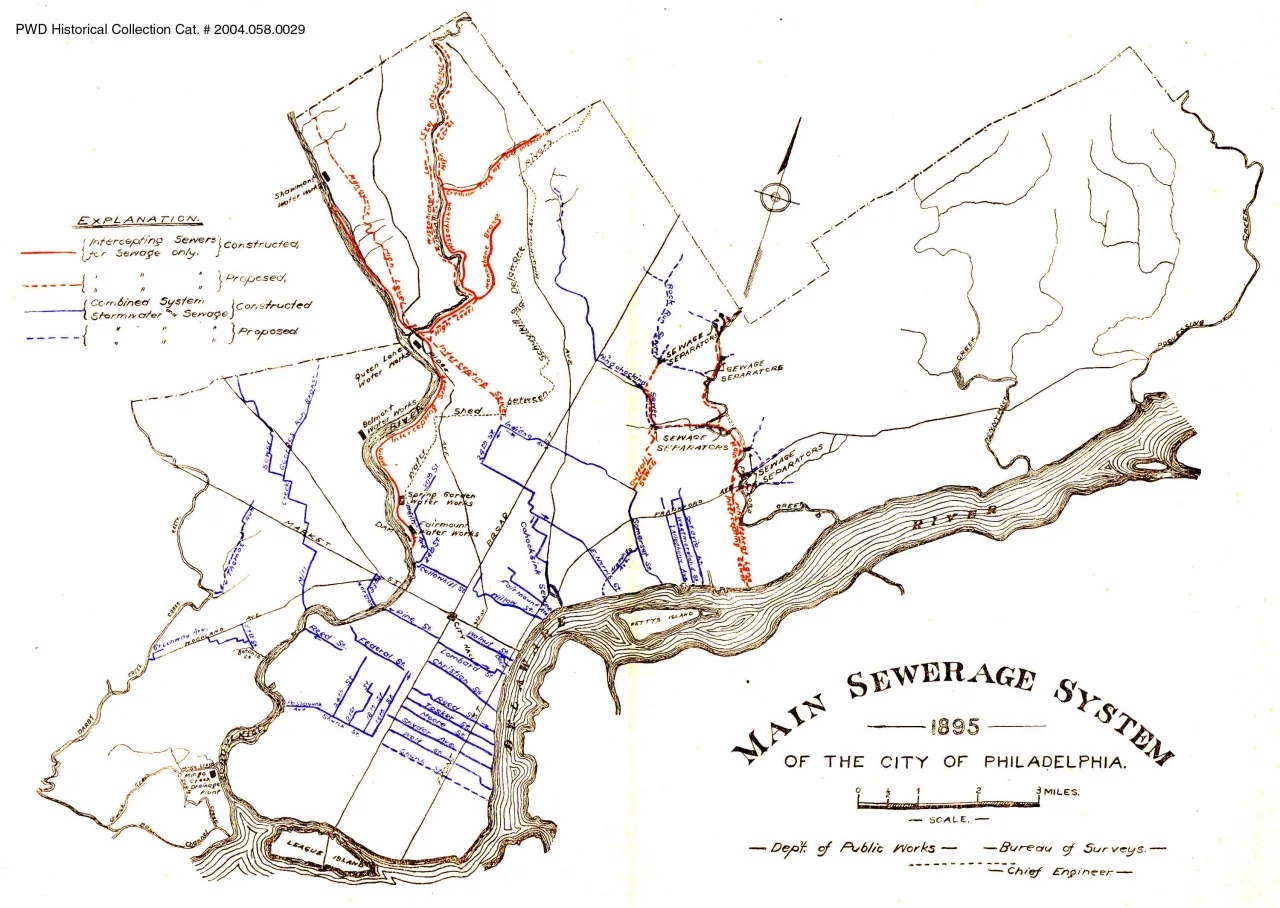
Here is an 1895 map from the Water Department showing the proposed and existing sewers and how they head for and follow streams to take advantage of the gravity flow.

Here is an exaggerated topographic model of the city

Finally a diagram of Frankford Creek. The "A Snake That Will Be Straightened Out" says everything about the attitude of conquering nature that was prevalent at the time.
There's plenty more to read about Philadelphia's water system here and other cities here.