Thursday, March 29, 2018

Landmarks: Maps as Literary Illustration

On Tuesday I got a chance to see an exhibit at Harvard University's Houghton Library called Landmarks: Maps as Literary Illustration. There was a great talk by illustrator and Cinemaps author Andrew DeGraff (whose own work is worthy of a future blog post) followed by a tour of the gallery. I hope to get back to share more before the exhibit closes (April 14th-soon!) but for now here are a couple of crude pictures I took with my phone. The description cards are mostly legible. Maybe I can get better pictures on a future visit.

Here are some Dell Mapbacks - more about Mapbacks here.
Finally, a Nancy Drew mystery.


Wednesday, March 28, 2018

New Hobby Part 2

Here's a color pencil map of West Africa I recently did based on the Times Atlas of the World.
By the time I got to the easternmost countries, the accuracy started to come off the rails. Ghana is way too narrow and I had to bend Benin to make it meet the corner of Niger. Here is a hastily done annotated version.
While gaining context it loses some of charm of the original. I might try to hand annotate it at some point.

In my previous post on this subject, I stated that I haven't done any hand drawn maps since childhood. However, I recently was cleaning up and found this watercolor painting I did in a college class. It was drawn from an atlas. I did this so long ago I don't remember the source but I think it was National Geographic. There was a page about the tectonic forces that created Pennsylvania's ridge and valley system with this map showing Blue and Second Mountain cutting through the Susquehanna River valley north of Harrisburg.

Tuesday, March 20, 2018

Bird Migrations

National Geographic's March Issue features a great map of bird migrations. Some of these birds fly halfway around the world to find food and suitable breeding grounds. They have put some remarkable interactive graphics online. Here is a video of the seasonal migration of the Magnolia Warbler.
Here's another one via their Twitter feed.
https://t.co/pRGcWHZvcs pic.twitter.com/ECmLIwercU


This video shows the annual cycle of vegetation that birds follow to assure the best supply of food.

Enjoy the full set of graphics and audio content here.

Wednesday, March 14, 2018

Pi Day

Happy Pi Day (3/14) - here are a couple of related mapping projects. The Pi Project is a series of hand-casted sculptures of each digit in the pi sequence.
This project "will one day be recognized as the largest art installation in the world using data visualization and sculpture, centered around the infinite number sequence of Pi." The numbers are shipped around the world-here is an interactive map of their locations. You can hover over each number to see its location and sequence within Pi's digits.


Martin Krzywinski is a scientist and data visualizer who has created many Pi Day visualizations. This year's version involves road maps.
http://mkweb.bcgsc.ca/pi/piday2018/
I'll let the author explain in his own words - full details here

City strips are horizontal arrangements of patches of roads sampled from a city. The order of the patches is determined by the digits of π, which are used to select regions of specific density of roads. 

No color—just lines. Lines from Marrakesh, Prague, Istanbul, Nice and other destinations for the mind and the heart.
 Last year he created an imaginary star chart using successive series of 12 digits from pi to define latitude, longitude and brightness. The stars are grouped into constellations honoring extinct animals - our evolutionary ancestors. Here is an example - the artwork can be purchased here.
http://mkweb.bcgsc.ca/pi/piday2017/posters.mhtml

Wednesday, March 7, 2018

The Dark Side of Drifters

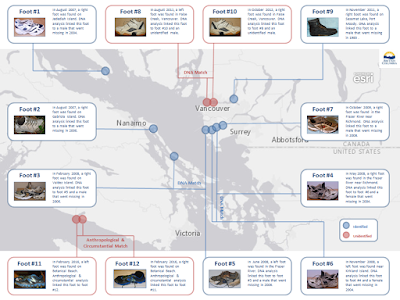
Last week's tale of ocean drifters has an ominous side. In the past decade 14-18 feet (depending on the source) have washed up on beaches in British Columbia. Here's a detailed map with descriptions of the first 12 feet - via Global News
https://shawglobalnews.files.wordpress.com/2016/02/newmap.png
While this sounds like some sick amputation ritual and has inspired some dark literature, scientists say that it is natural for feet to separate from the body and that these deaths were not from foul play. The deaths are considered drownings or suicide. Most of these feet were wearing sneakers (or running shoes or athletic shoes or trainers, depending on the article and your regional term.) These shoes may have helped preserve the feet while other parts of the body have decomposed or possibly been eaten.

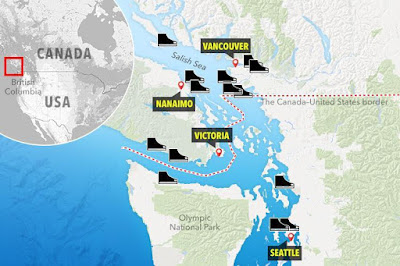
While there are probably bodies floating around most coastal areas, the unique geography and currents of the Salish Sea (including BC's Strait of Georgia and Washington's Puget Sound) have made these feet more likely to end up on the shore. Here's a map from the Sun (UK edition) showing the entire region.
https://www.thesun.co.uk/wp-content/uploads/2017/12/dd-composite-salish-sea.jpg?strip=all&quality=100&w=960
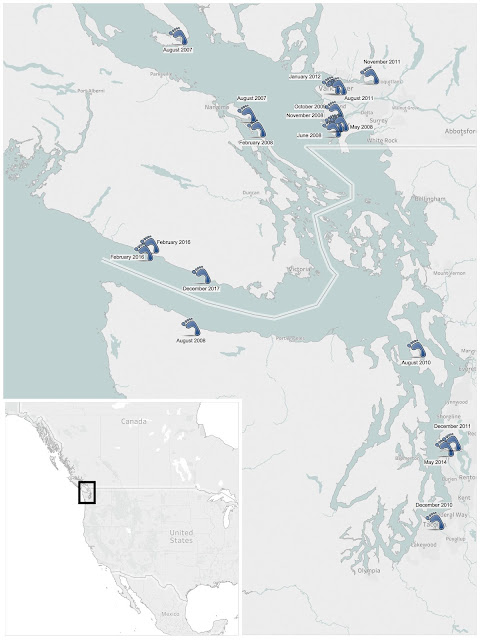
There's also a Wikipedia page about this phenomenon with its own (less dramatic) map.
https://upload.wikimedia.org/wikipedia/commons/6/69/Salish_feet.jpg