
I recently watched the PBS documentary Sinking Cities: Miami. One thing that jumped out at me was this map. I could not find this version (from about 1835) online but here is a screen shot from about 20:45 in.
 Basically the entire Miami area, except for a few spots along the coast, and the rest of soutrhern Florida was part of the Everglades swamp. Here is an 1856 version of the same map - via the Florida Center for Instructional Technology.
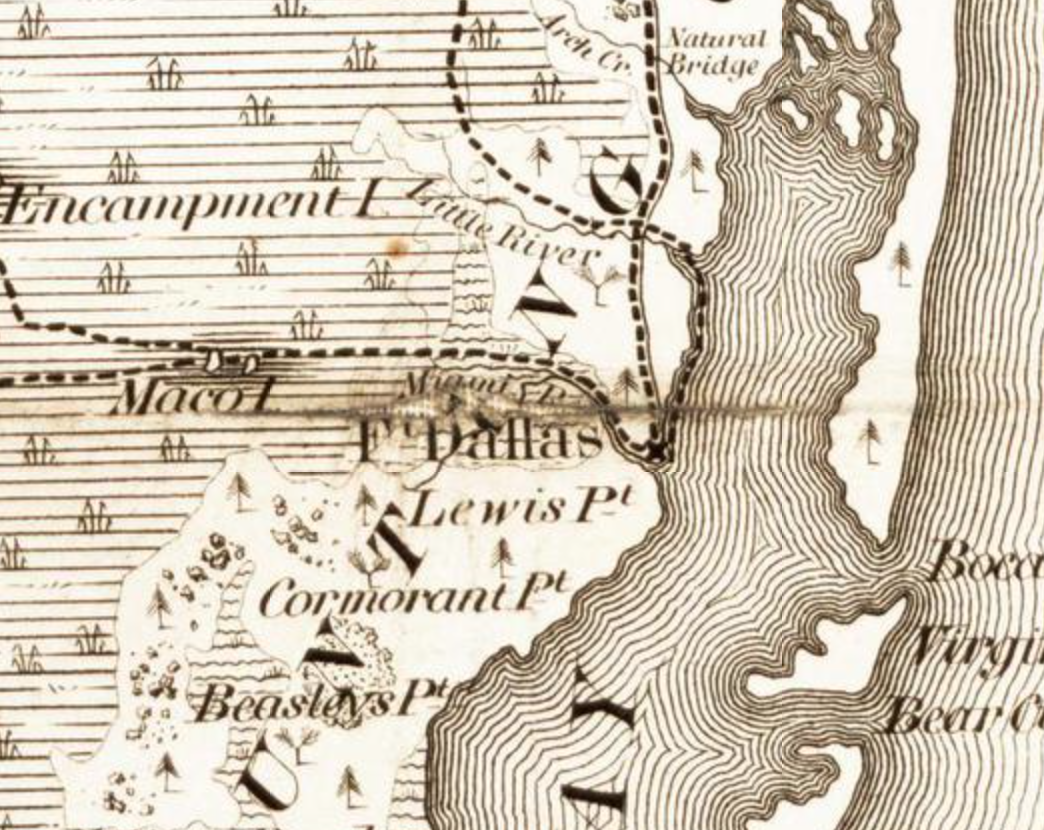
 The map can be browsed at the Newberry Library. Here is the Miami area (Fort Dallas) - a few uplands (listed as the Koontee and Hunting Grounds) surrounded by swamp.
 By draining large parts of the Everglades, the city's developers have been able to create vast tracts of habitable and desirable land in these former swamps. However, sea level rise is starting to create problems from nuisance flooding (even on sunny days high tides can push up the ground water and cause flooding) to large scale storm destruction. This map, from National Geographic via Catalyst Miami shows areas that would be under water at high tide with a 5 foot sea level rise* and flood prone urban areas (in darker blue).

Here is a more readable close up of the Miami area.

One result of the recent increase in flooding has been climate gentrification. People are buying houses in formerly poor areas such as Little Haiti, away from the water that are on higher ground. The wealthiest can afford to engineer adaptations to rising sea levels but others are at a high risk of their homes becoming uninhabitable. These people can't as readily move and even if they could there are few affordable options for them.
This map via The New Tropic shows the Little Haiti area annotated with elevations above sea level. The heart of Little Haiti is between NE 2nd Ave and NW 2nd Ave. The author tries to determine how much gentrification is climate related but with many other factors involved ultimately is not able to draw a conclusion. However, the map does show why these areas would be desirable to those moving from further east (or even west where elevations are also lower).
 * predictions for sea level rise range from about 1 to 3 feet by 2100 - more here.

Here is a more readable close up of the Miami area.

One result of the recent increase in flooding has been climate gentrification. People are buying houses in formerly poor areas such as Little Haiti, away from the water that are on higher ground. The wealthiest can afford to engineer adaptations to rising sea levels but others are at a high risk of their homes becoming uninhabitable. These people can't as readily move and even if they could there are few affordable options for them.
This map via The New Tropic shows the Little Haiti area annotated with elevations above sea level. The heart of Little Haiti is between NE 2nd Ave and NW 2nd Ave. The author tries to determine how much gentrification is climate related but with many other factors involved ultimately is not able to draw a conclusion. However, the map does show why these areas would be desirable to those moving from further east (or even west where elevations are also lower).


No comments:
Post a Comment