
Chris Whong, a former planner for the City of New York found a way to muddle through various budget documents to quantify and map where money is being spent on capital projects. The process, documented in a Medium article, involved "scraping" PDF documents ("where data goes to die") and then grouping projects by district to look at his own neighborhood in Brooklyn. Here is the result - click for a more readable version
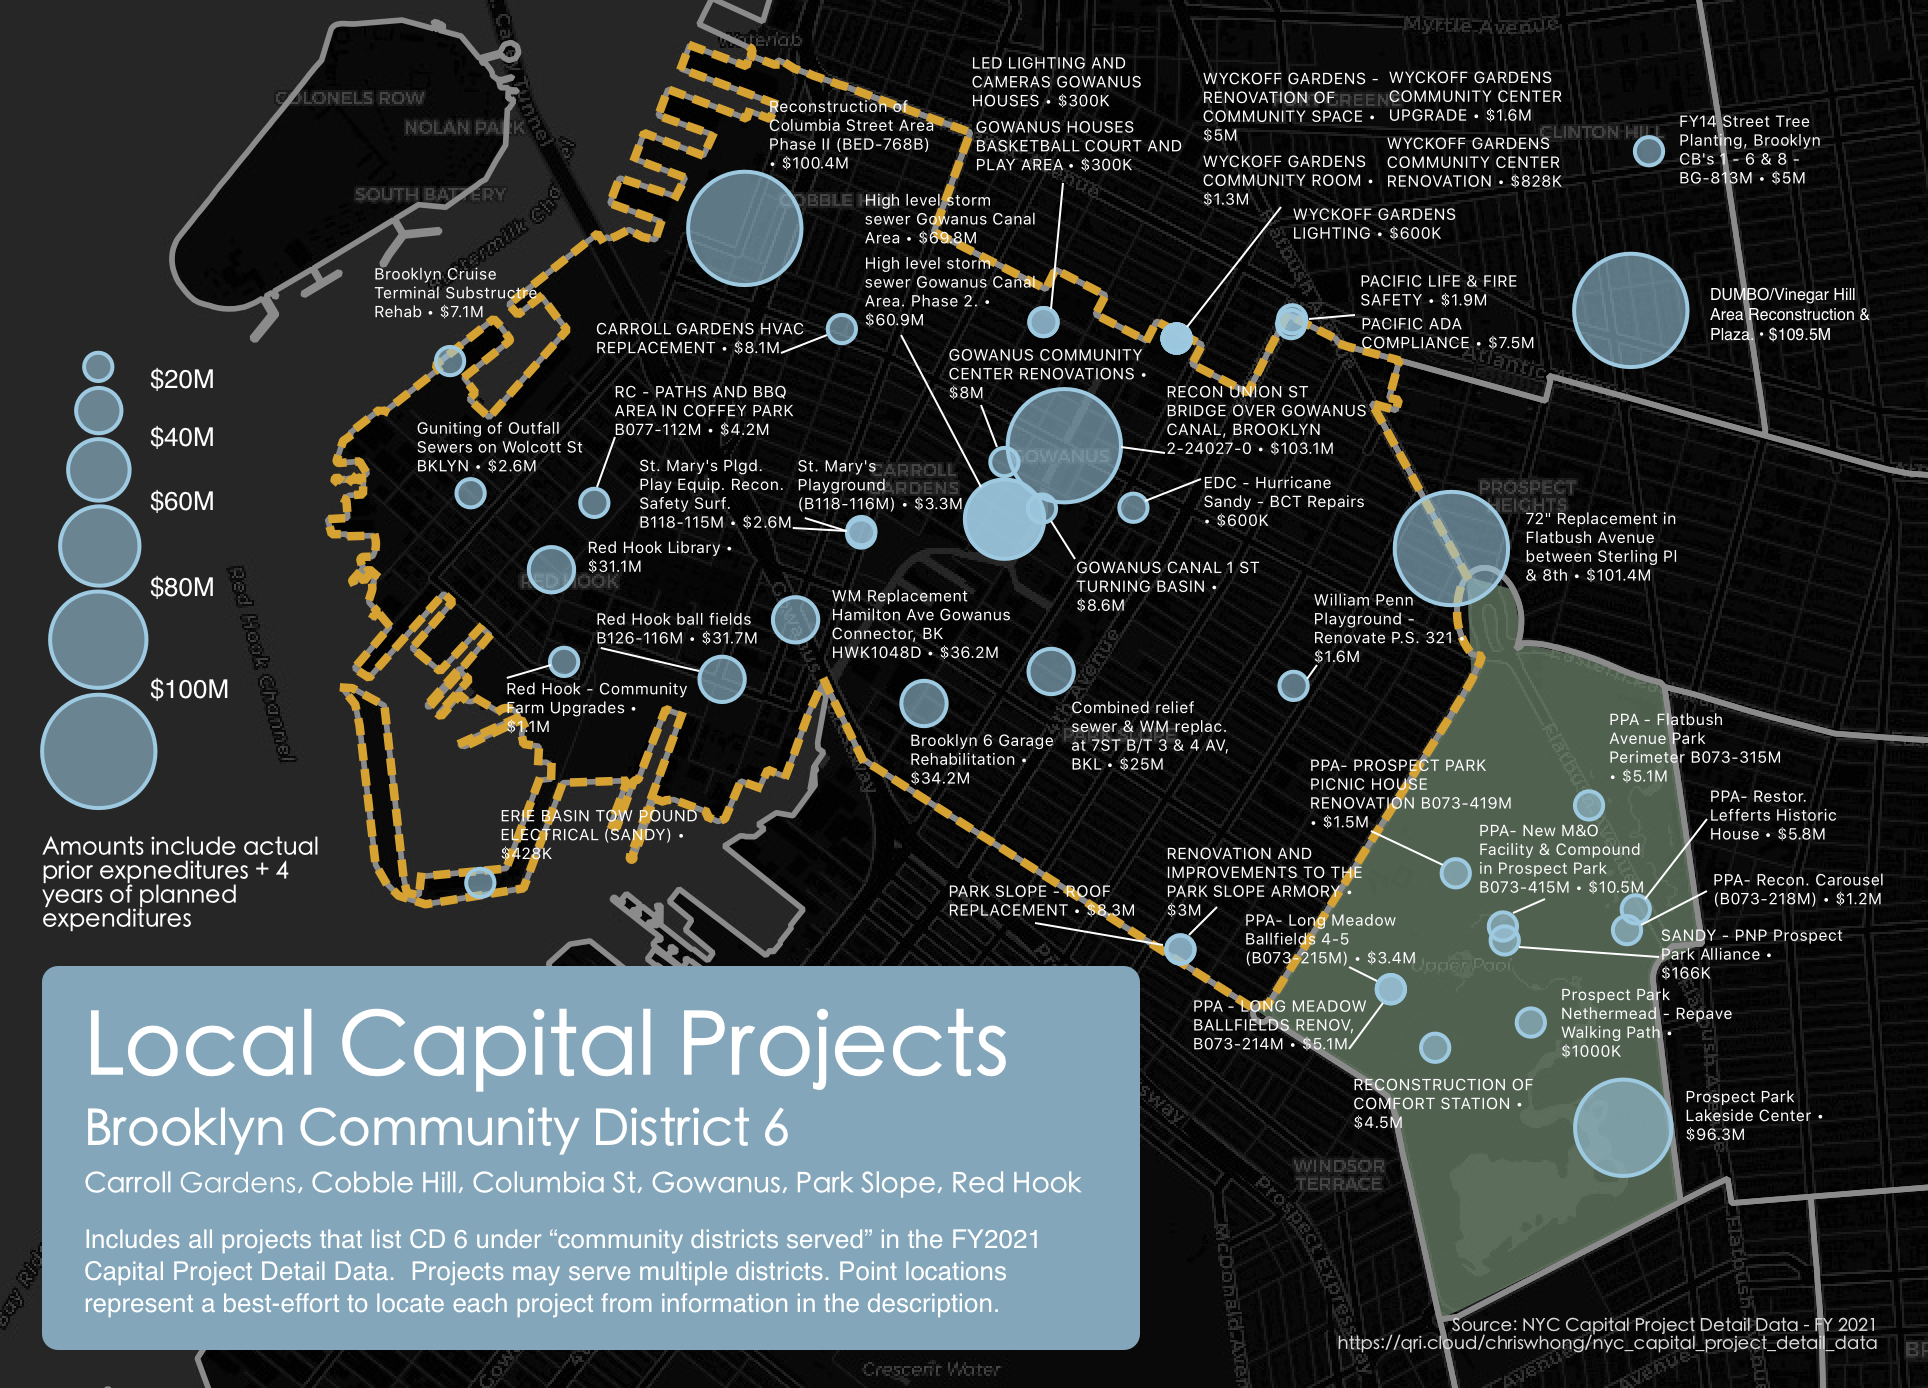
A sample area.

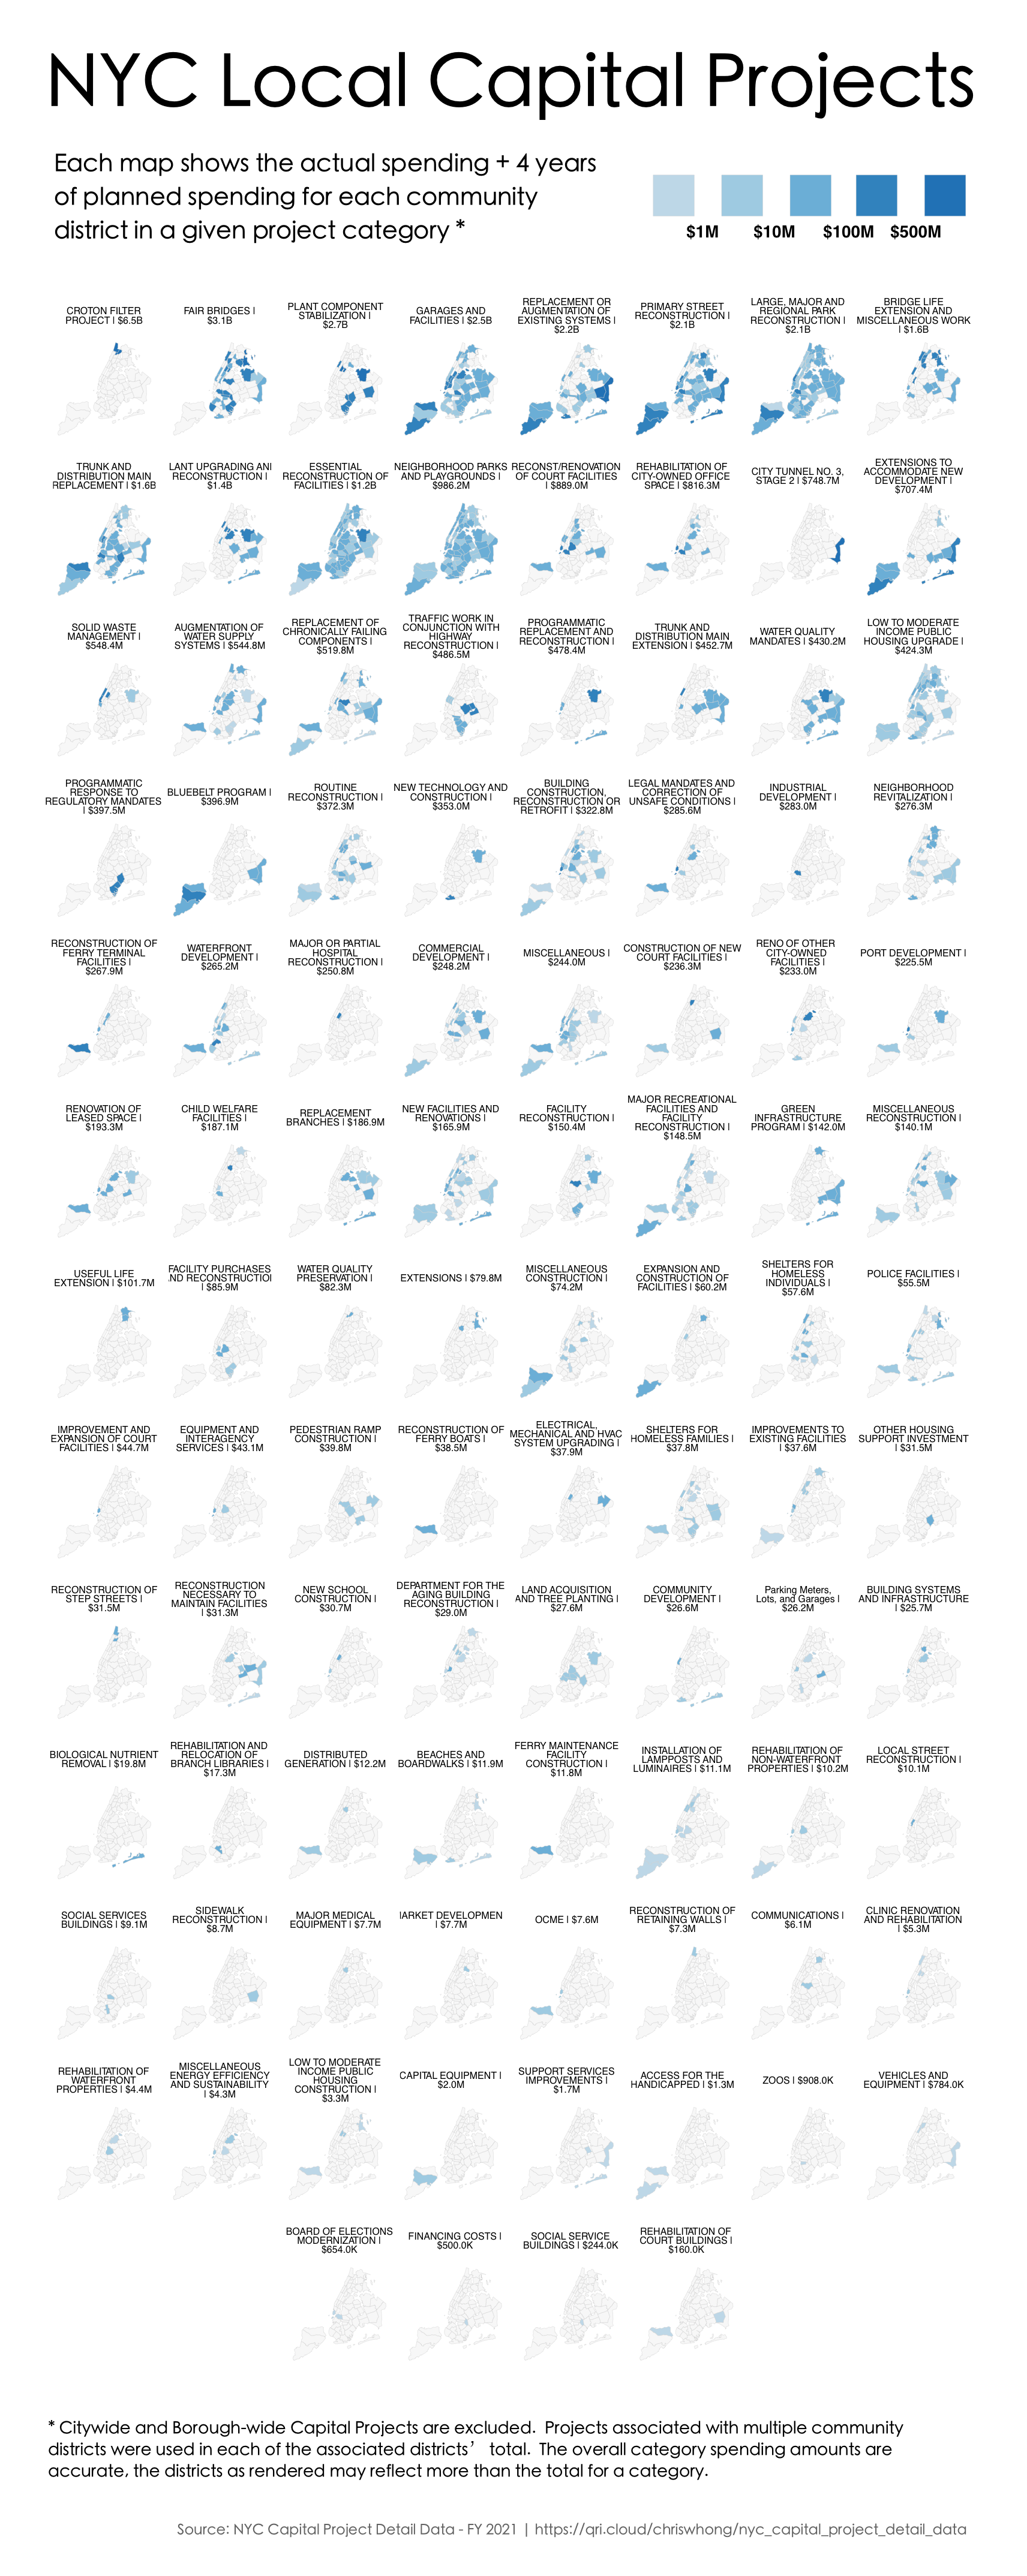
He also did some nice "small multiple" maps showing 4 year spending by project type across the city. The image below is just a sample - the thing is huge. Clicking it will get you the whole thing.
For details on the convoluted process click here.


No comments:
Post a Comment