Wednesday, October 30, 2024

Bad News For Local News

Northwestern University’s Medill Local News Initiative released the latest State of Local News. It highlights the dire state of print journalism with maps to illustrate the problems. This one highlights counties that are on the watch list to become news deserts.


News deserts are defined as counties with no local news outlet. Counties on the watch list have only one news outlet and a high poverty rate putting them at an elevated risk of losing that outlet. You can hover over each county for specifics on this map.


The six largest newspaper chains own about 20% of the country’s daily and weekly papers with a presence in every state except for West Virginia.


Digital local news sites are also concentrated among a few major players while geographically concentrated in metropolitan areas.


For some levity, a few bright spots are also highlighted. These are startup news organizations”creatively working toward sustainable business models” - the white dots on the map below as well as some featured spots (the blue stars). The counties are colored by number of news outlets from 0 (very dark) to 10 or more (the brightest colors).

The full report can be seen here.


Wednesday, October 23, 2024

Terrain Representations from the Atlas of Design

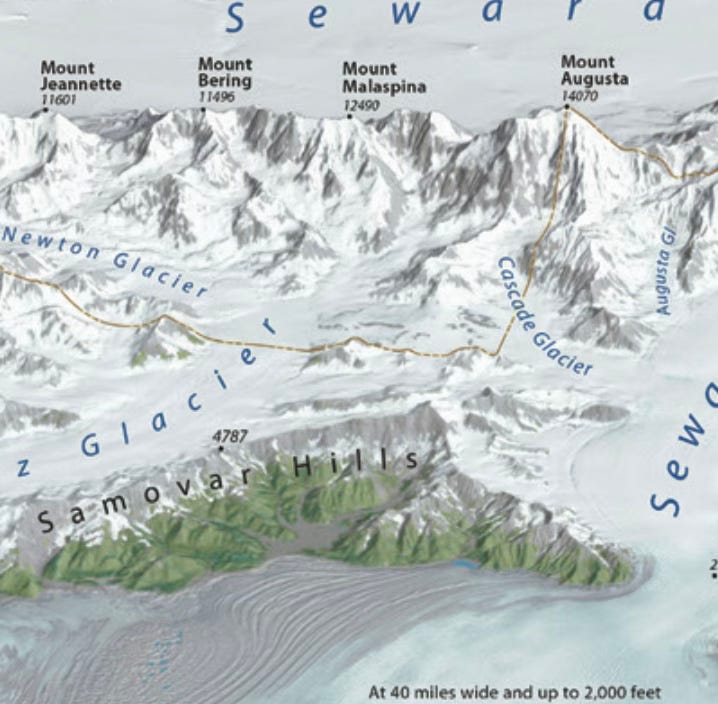
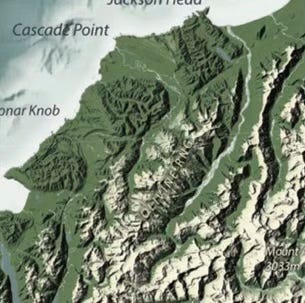
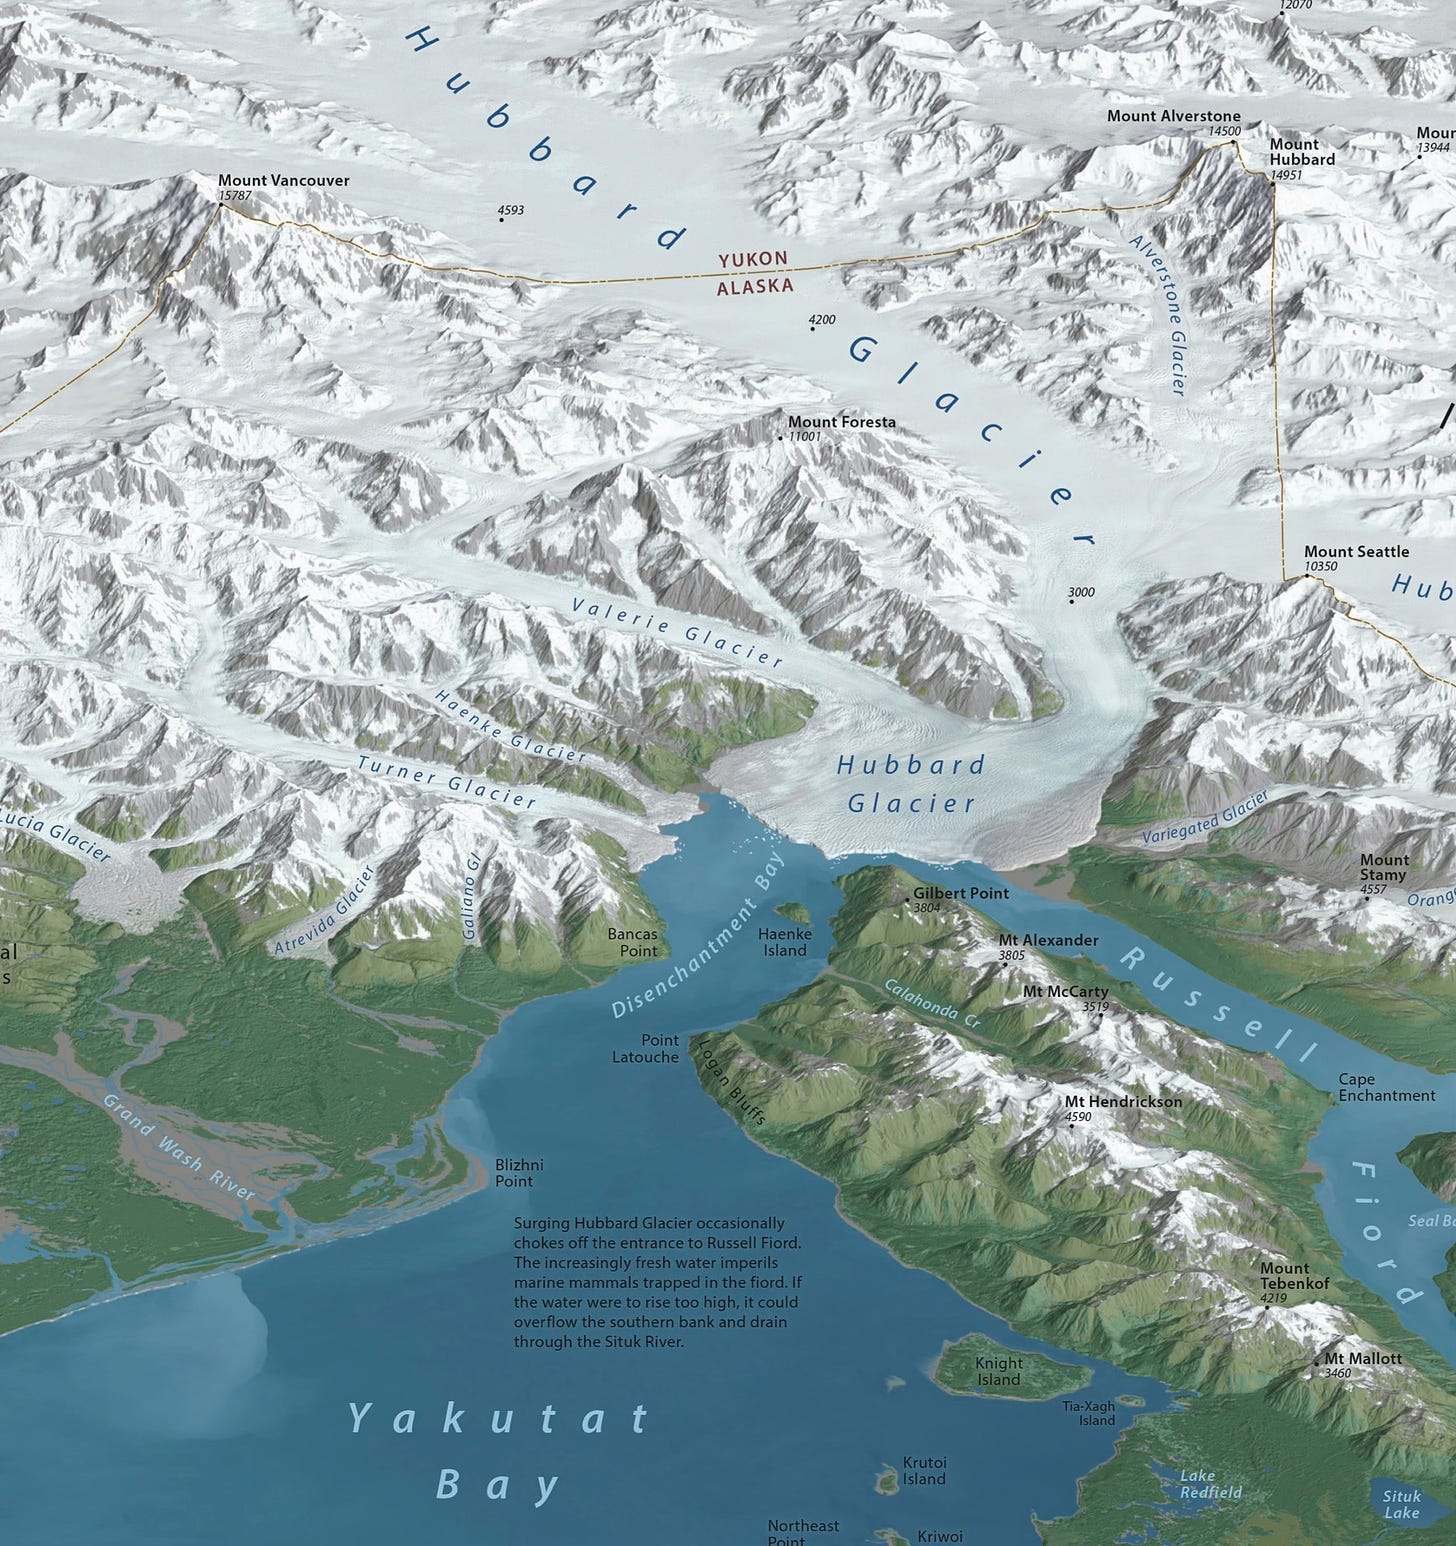
In last week’s post I reviewed Volume 7 of the Atlas of Design. As an occasional cartographer I have been interested in how topography is represented in maps for a long time. This atlas volume provides many contrasting examples. From the “cartographic realism” of Tom Patterson’s Malaspina Glacier map,

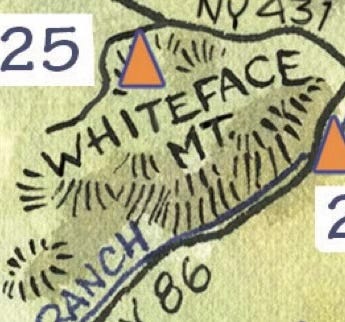
to the sketchy, hatchy peaks of the Adirondack Paint Map (with added shading), 

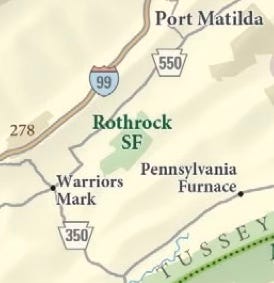
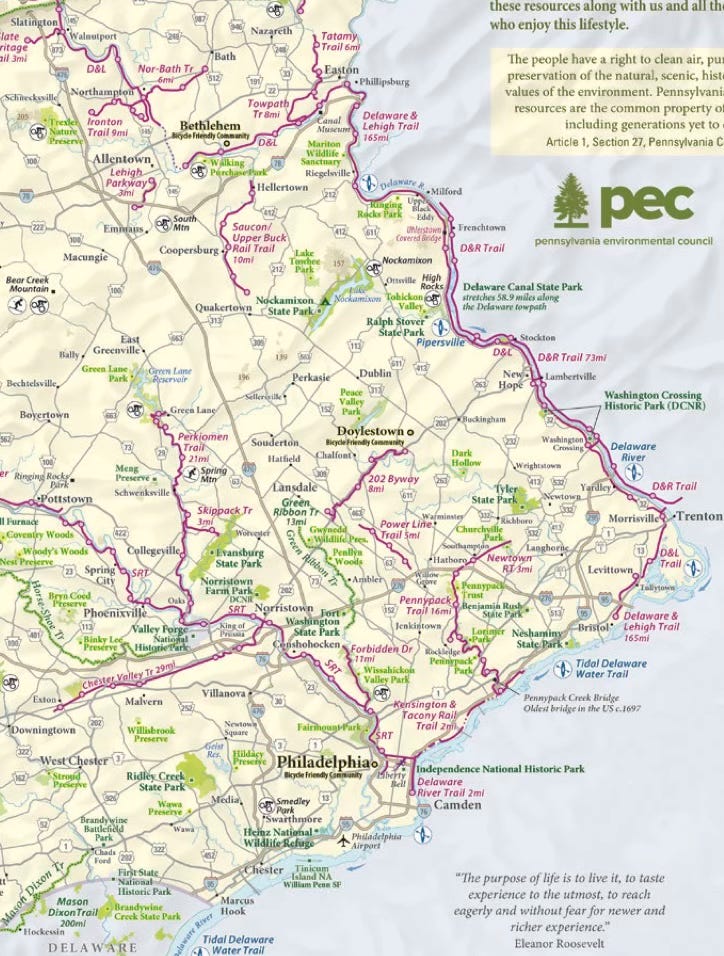
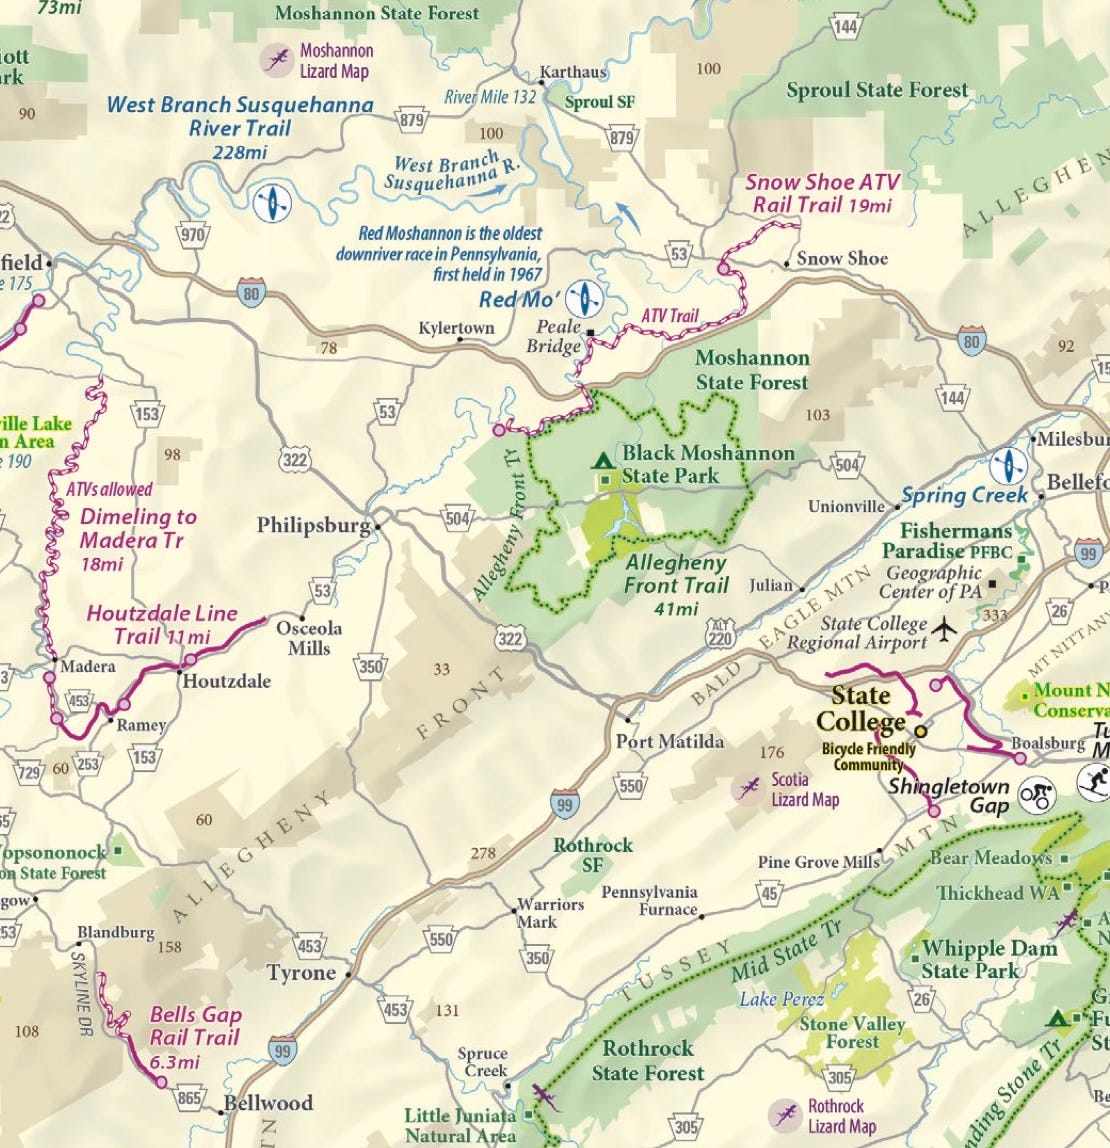
to the very subtle shading of the Purple Lizard Maps recreation map of Pennsylvania.

There are quite a few very different approaches and this post will be more about appreciation than technique. I wish I could speak more about the processes used but I know little beyond using the standard hill shading algorithms in mapping software and one or two not very successful tries at using Rayshader. I suspect these techniques were at least partially used in many of these maps but there are many artistic flourishes these cartographers have used. 

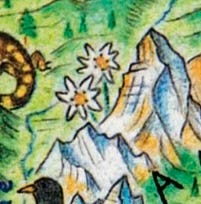
Wild World by Anton Thomas is pure art with computers only used to position features. Here is his drawing of the Matterhorn in Switzerland.

Ian Reese’s Aotearoa/New Zealand Map used many layers and blending modes between them to get his semi realistic look.

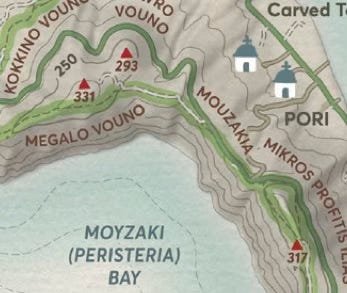
For the Santorini Islands map Spyridon Strides uses contour lines combined with shading.

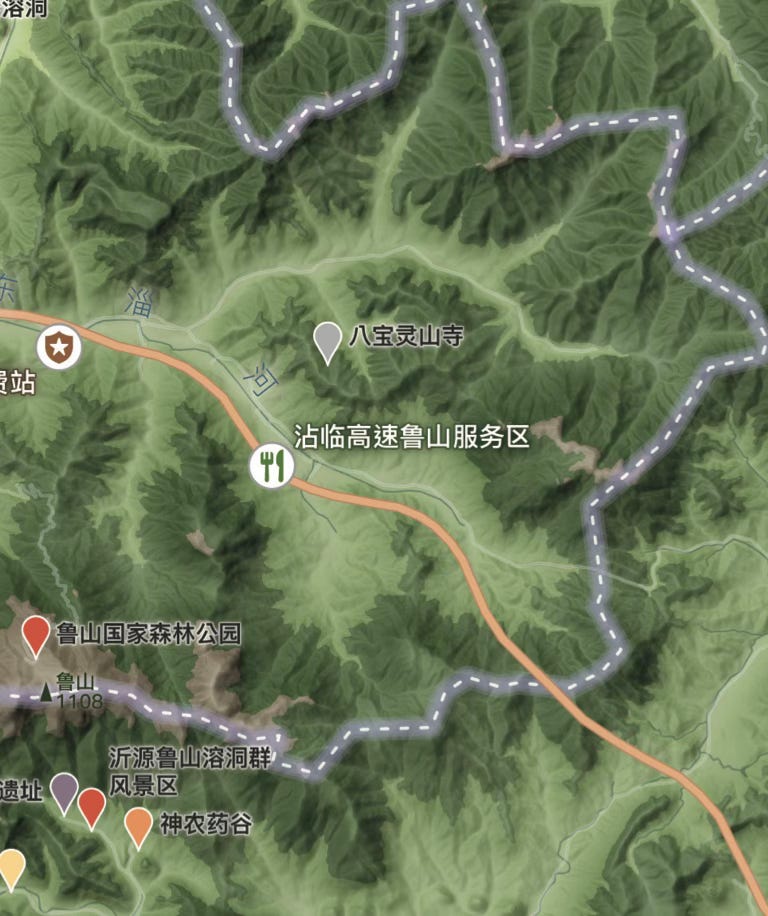
The Zibo Map of Culture and Tourism uses a mixture of colors and shades to create a green fuzzy effect.

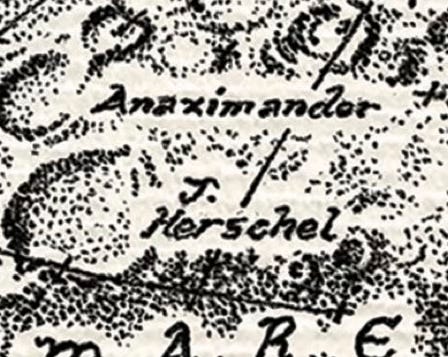
How do you represent terrain on the moon? In this case with well placed dots.

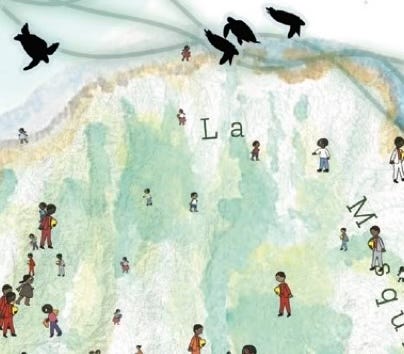
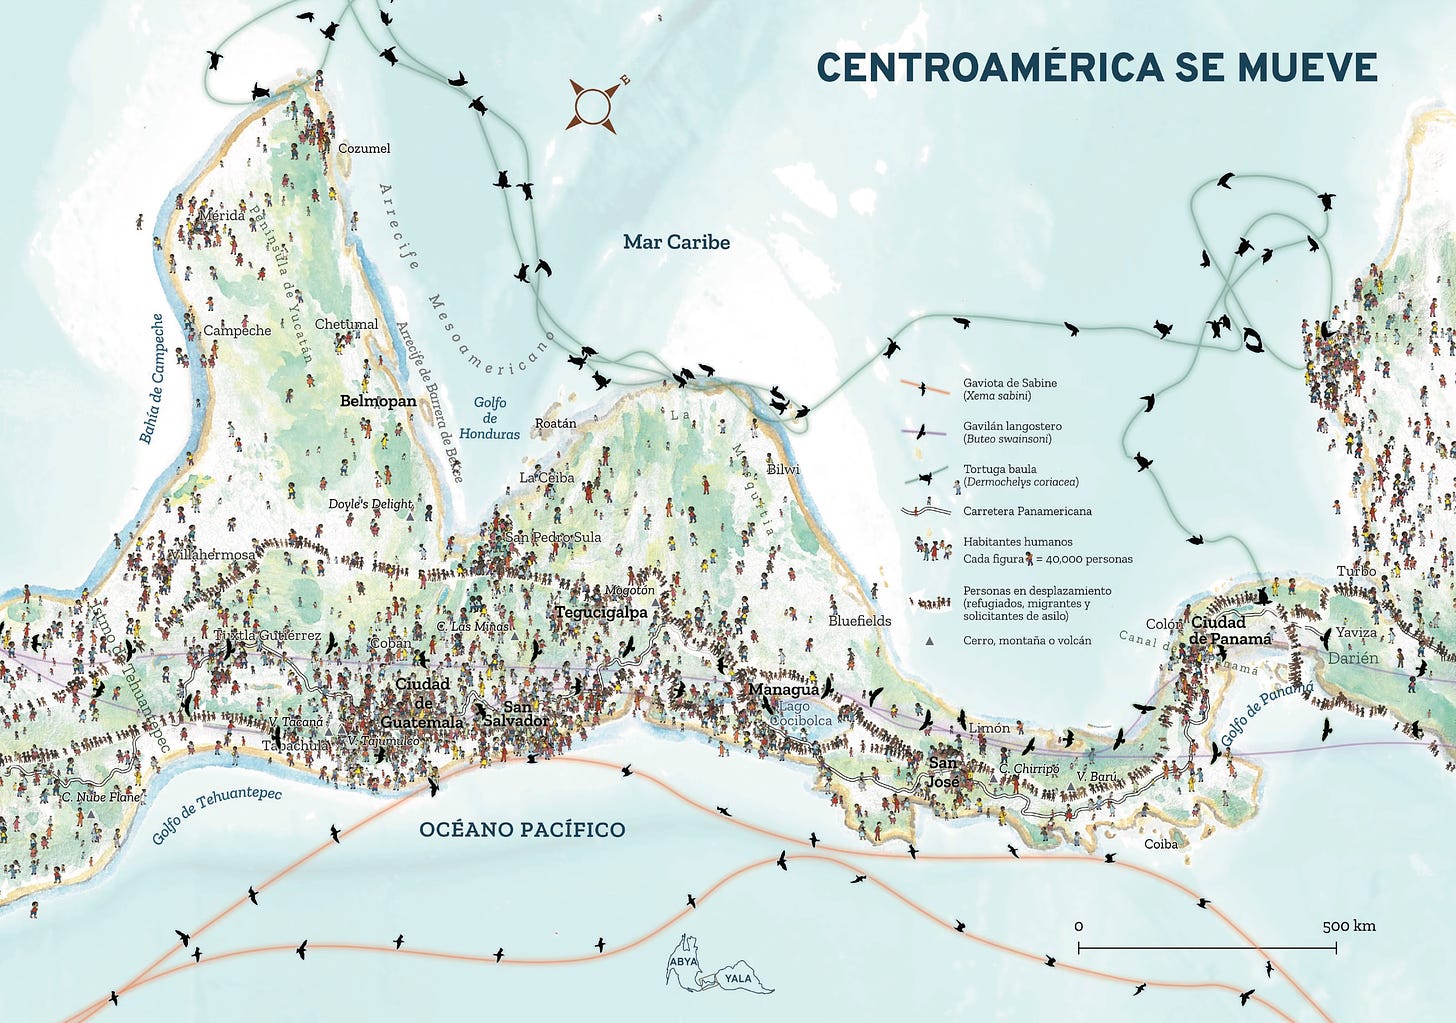
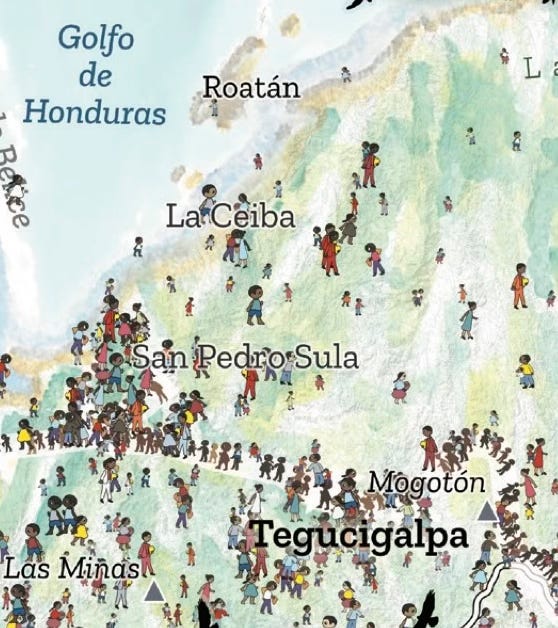
The “Centroamerica se mueve” map uses subtle watercolor effects.

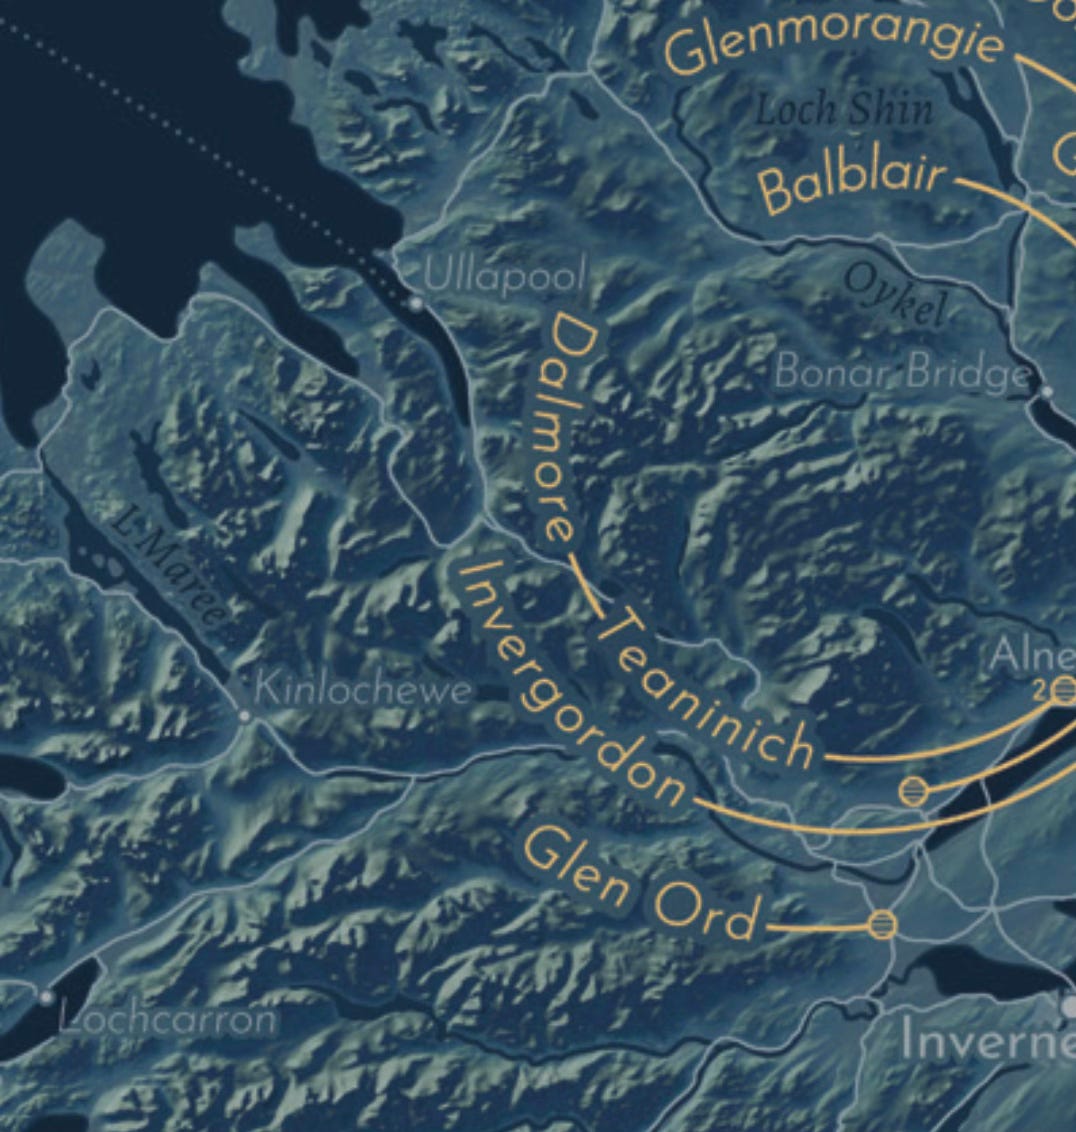
The map of Scotch distilleries uses a “layered pie” overlay of hill shading colored in a blue to gold gradient with some mist to add depth to the lowlands.

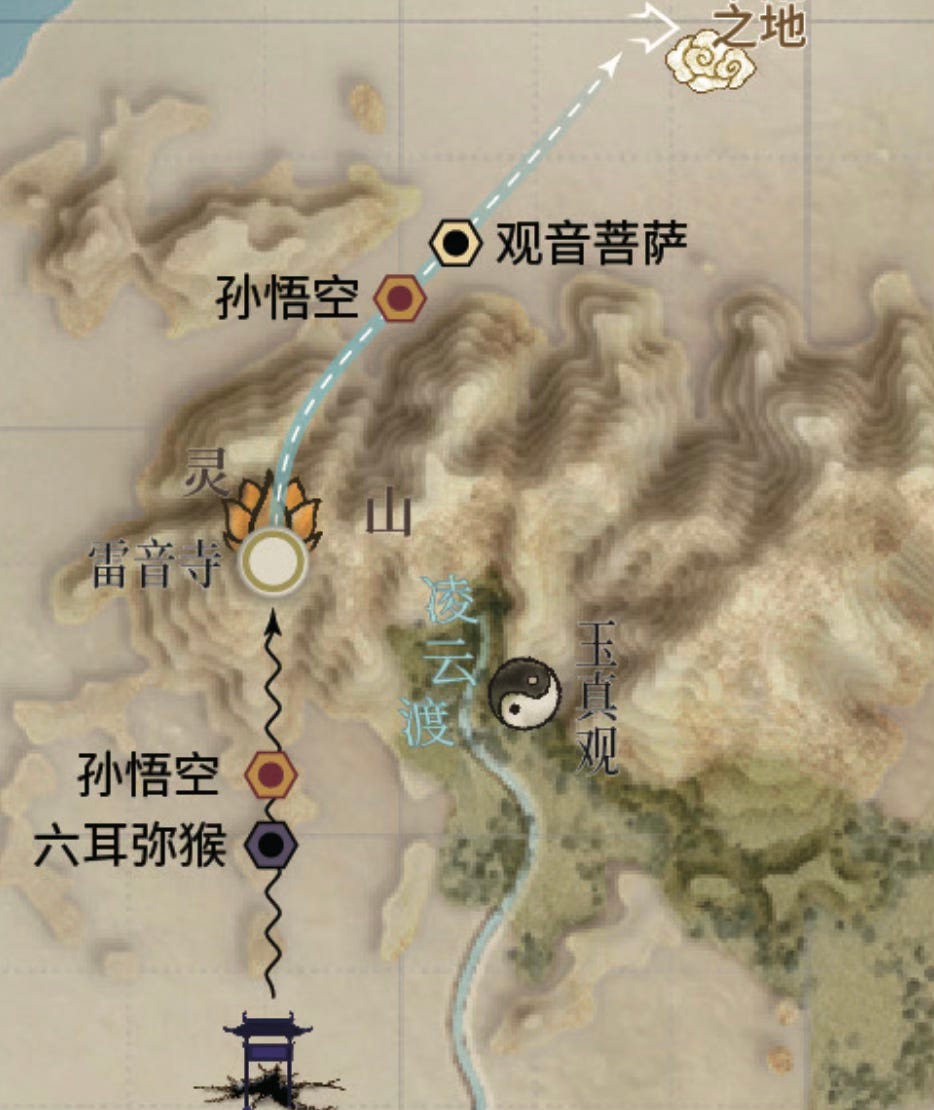
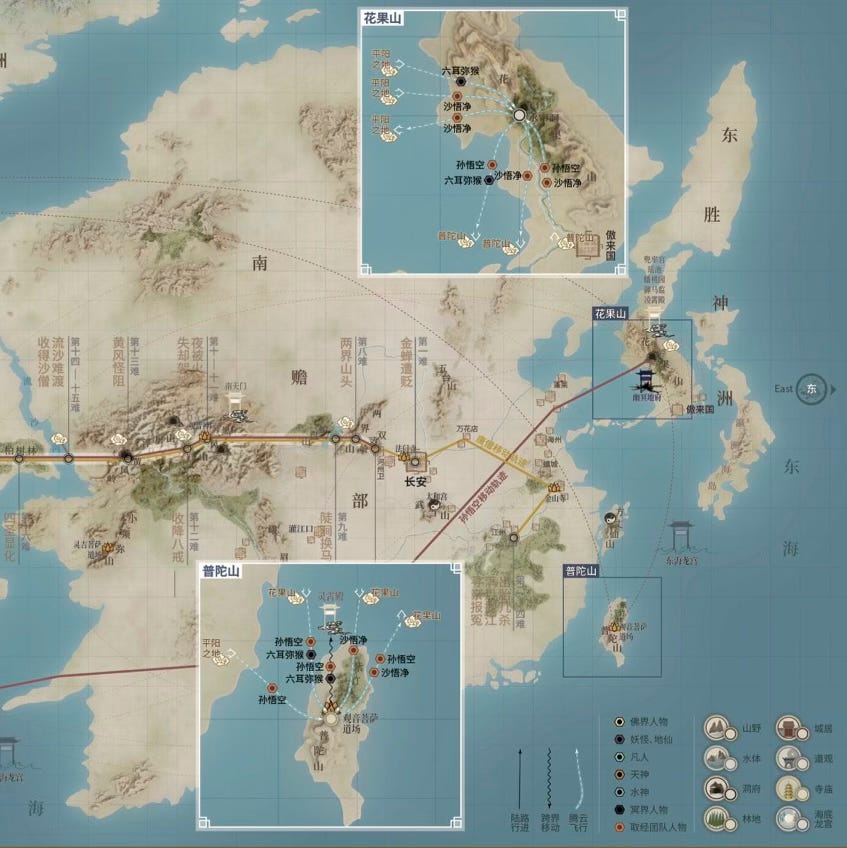
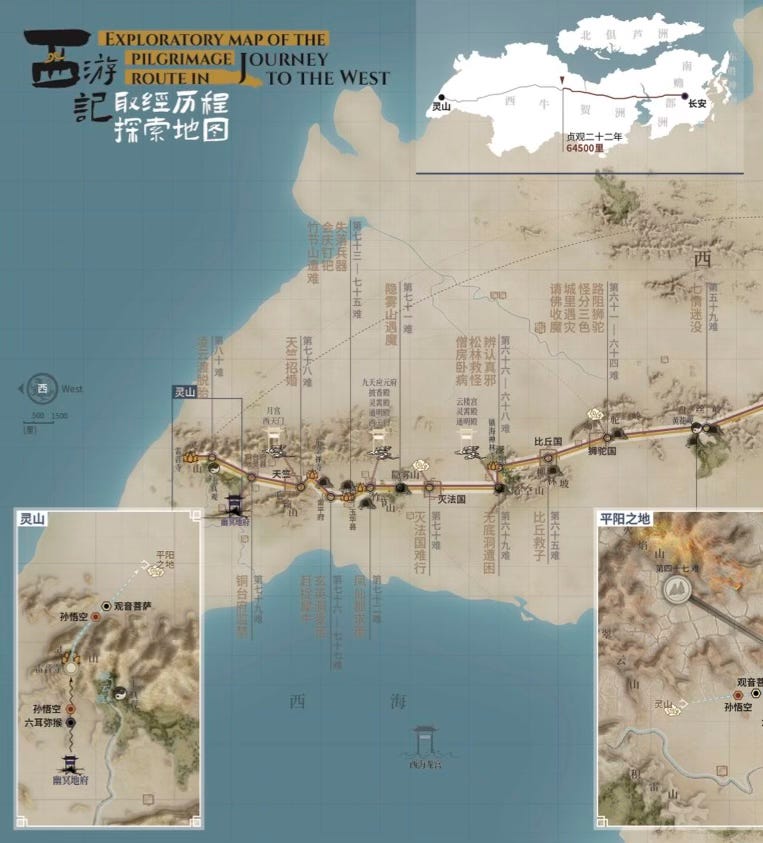
The Journey to the West map uses an interesting layer cake look with a contour and shading combination. Though it does not look as realistic as some of the above examples, I like the effect.

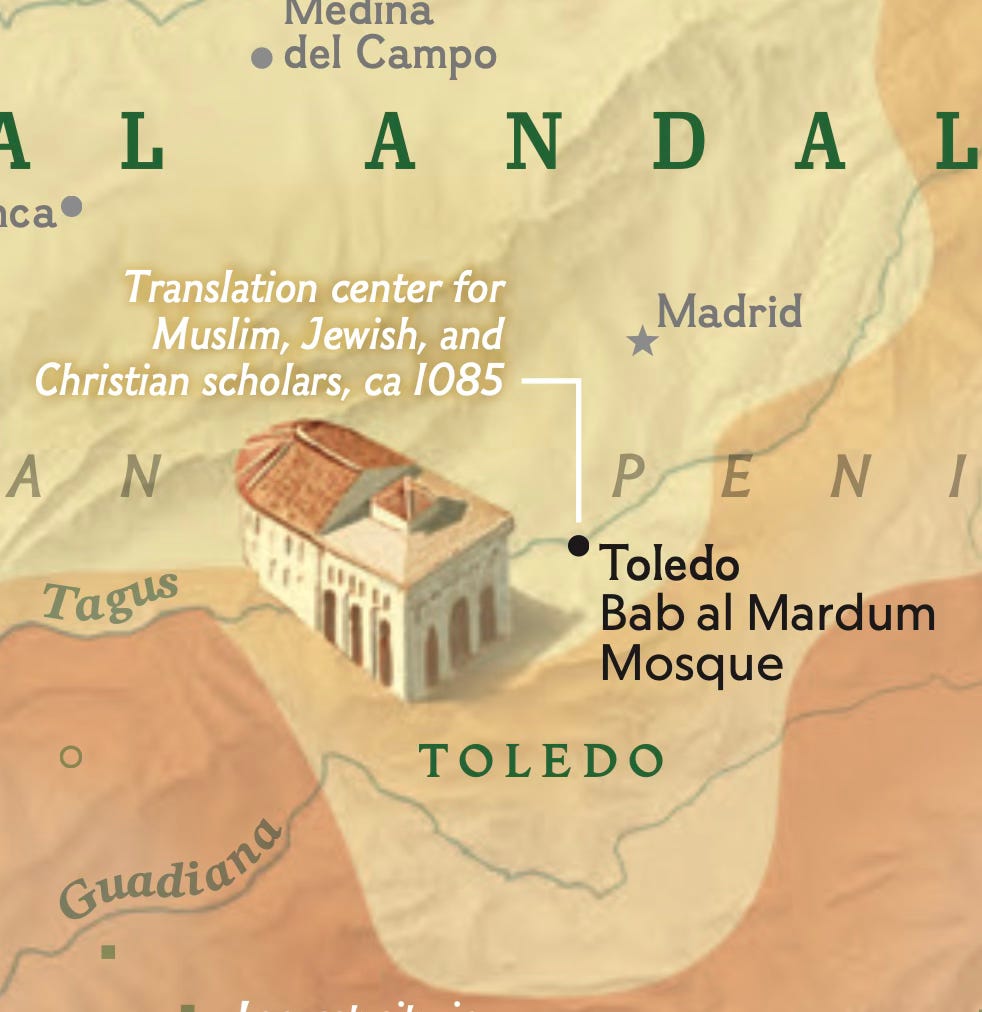
Finally, “Spain’s Muslim Era”, made for National Geographic uses a very subtle hill shading in order to not compete with all the other dense information typical of NatGeo maps.

Wednesday, October 16, 2024

The Atlas of Design, Volume 7

Note to readers on this platform: I also publish this blog on Substack. You may find that the pictures below show up a little better than here.

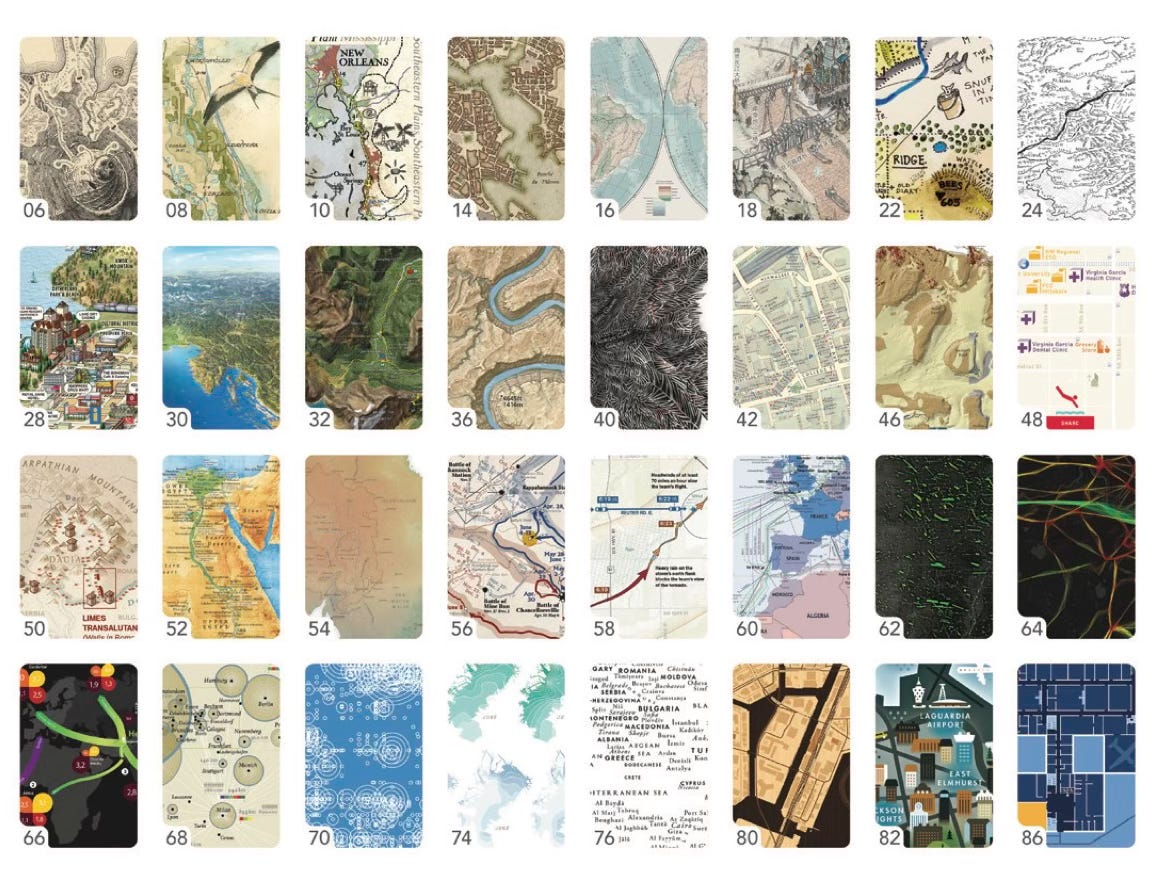
The Atlas of Design is a biannual production of the North American Cartographic Information Society (NACIS). It highlights some of the most beautifully informative maps, chosen by NACIS members to highlight thoughtful design and communication. I last reviewed one of these volumes back in (checks notes) 2015 (Volume 2) - time gets away from us all. One of my favorite features is the sample image table of contents.

Some of these maps and authors I’ve covered in the past while others may appear in future posts, therefore you won’t see every map I love below. For example I did a post about a much earlier version of Wild World by Anton Thomas before he had a name for it. It has evolved quite a bit since 2018. Here is a sample.

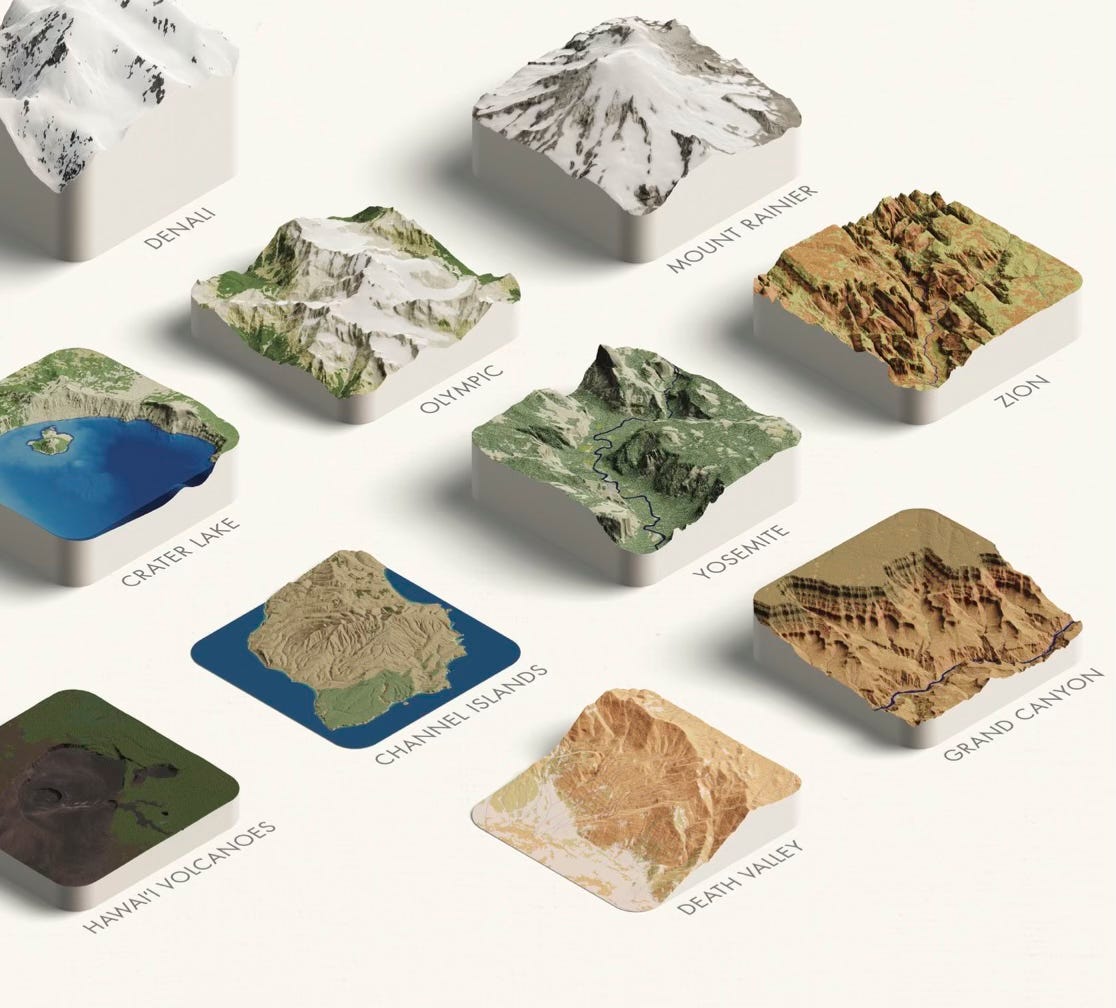
Speaking of tasty samples, here is a sweet idea; National Park Elevations presented like a candy sampler.

The project is called “A Delicious View of US National Parks” by Wendy Shijia Wang and R J Andrews.

I’ve long admired the gorgeous 3D mapping of Tom Patterson who created this panorama style view of Malaspina Glacier for the U.S. National Park Service. This map seeks to visually unify an area that is divided between the United States (Alaska) and Canada (Yukon).

This outdoor recreation map of Pennsylvania uses purple (a color I probably would not have considered) for rail trails and a more traditional green for hiking trails. The purple really stands out from the rest of the color palette to emphasize these trails.

Above is the area I grew up in while below is an area with a much lower human footprint. The purple lizards (“this could mean anything” from the legend) are a nice touch.

I’m quite fond of the Journey to the West map by Yue Zhang, Jinnuo Duan and Xi Tang of East China Normal University. The map shows the pilgrimage route from what is considered one of the great Chinese novels. The geography is a blend of real and fantasy. It begins with familiar shapes in the far east,

while getting further from reality as the journey moves westwards.

The map also distinguishes different types of movement (“flying, walking, escaping and so on,“) in different realms of mortals, ghosts and heaven.

Another map I’m very fond of is called “Centroamerica se mueve” (Central America Moves).

It is an empathetic map showing the movement of people as well as several species birds and animals. The orientation is shifted from north to emphasize the travel corridor through the area. The drawings of individuals remind us that these are people seeking a better life, not criminals trying to poison our blood and walking thousands of mile just to vote illegally (or get transgender surgeries) as dishonest politicians claim.

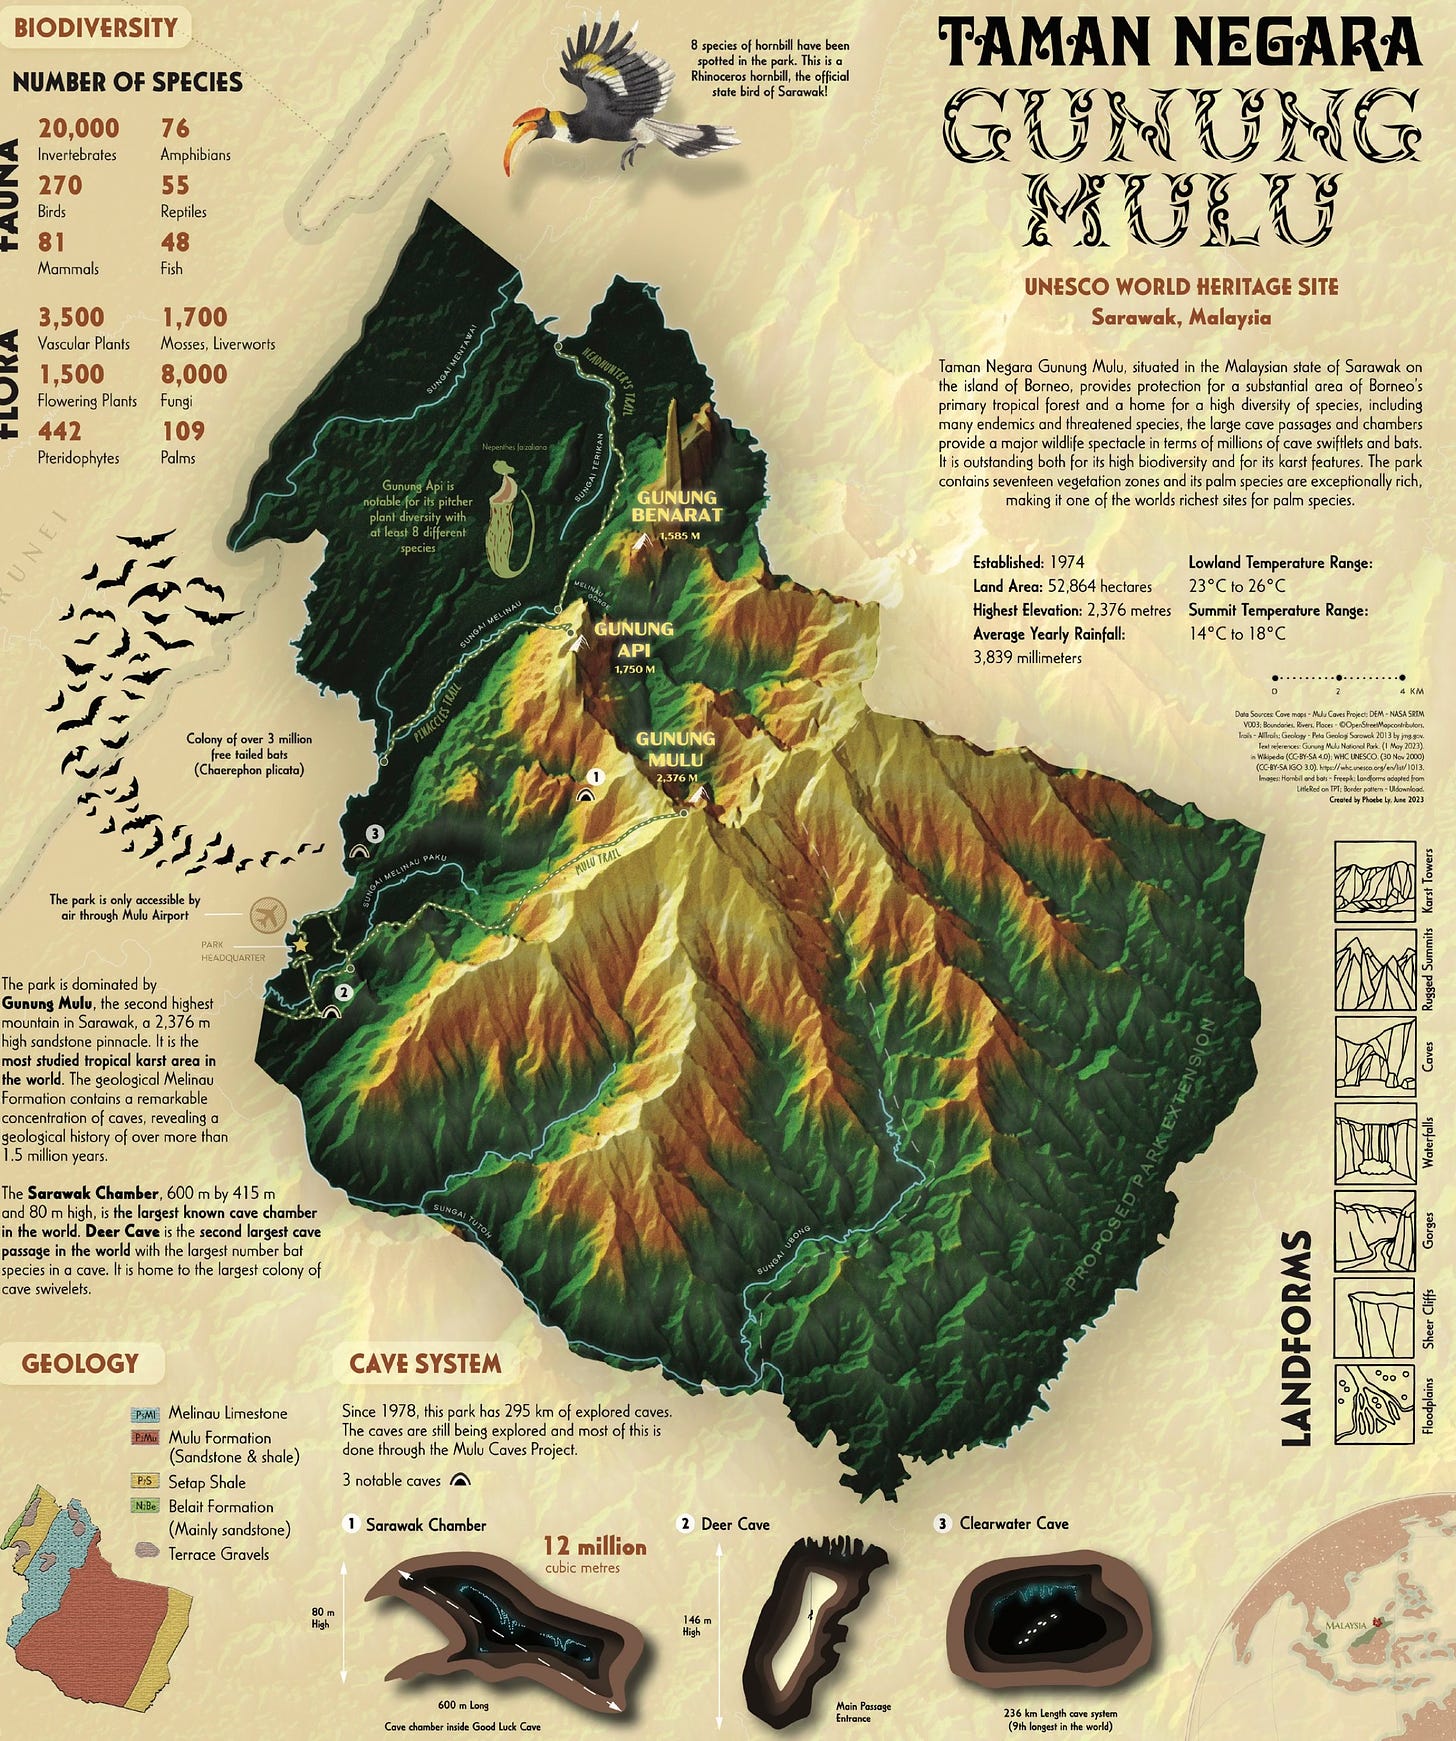
Finally, here is an otherwise beautifully laid out map with a questionably (to me) bold color scheme. This may be a matter of personal taste or cultural differences. The map is of a National Park in Malaysia. 

The map is dense with a ton of information including cave systems, landforms and my favorite touch; the bats coming out of the cave to the left. I find the yellow at the highest elevations to be distracting while the very dark low elevations make those areas hard to read. Otherwise this is a really well done map.

One suggestion for the authors is to have a line or two about what medium was used for each map. If hand drawn was it ink, watercolors, colored pencil or something else. If computer generated what type of software (drawing program, photoshop, GIS etc.) was used. I don’t think the exact software or technique needs to be revealed but a general idea of how the map was compiled and drawn would be very useful.

The endpapers show the contents of the previous six volumes. 

I will be returning to some of these maps for a future post.  You can order it here.


Wednesday, October 9, 2024

Your Climate in 60 Years

This fall's supercharged hurricanes are a reminder that despite the dishonest rhetoric coming from top Republican politicians, global warming is definitely not a hoax. The University of Maryland has a new mapping tool to show you where on earth your climate will most resemble in 60 years. 

So if you're in Chicago 60 years from now it will feel like you're near Tulsa.
 

Here are some images from an article in the Los Angeles Times. While most places follow a similar pattern (in the northern hemisphere heading a ways south), 

the unique geography of coastal California means if you live in Los Angeles, you don't have to travel far to experience your future.

Some places like Abidjan, Cote d'Ivoire give you this scary message

Future climate will be unlike anything currently found on Earth

The tool gives you the location and climate details of the analogous place. Here is an example from the southern hemisphere heading northwards.

Play around with it a bit, be scared and maybe even consider how you can lower your own carbon footprint. Or just wait for scientists and governments to come up with a magic solution. Good luck!

Wednesday, October 2, 2024

Make Your Own Ferraris Map

While researching the Ferraris Atlas of Belgium from my last post, I came across a Github page that lets you create your own Ferraris style map using QGIS. The author, Manuel Claeys Bouuaert did an excellent job creating a hand drawn looking style using modern technology. Warning: if you try this at home you will likely end up with many computer crashes and very slow data loads. Here was my first attempt.

I chose a village in northwestern Belgium based on a combination of city size and ability to navigate through the giant countrywide data set before the computer crashed. One recommendation is if you're going to download a whole country's worth of data, even a small one, you should find a small area and export it to much smaller files. An even better solution is to go directly to OpenStreetMap, zoom in on a very small area and export your own files. 

Another limitation here is that the street patterns are not the same as they were in 1777, with most places having grown significantly. Here is another town in Belgium, my QGIS version compared to the original atlas pages which can be browsed on Belgium's Royal Library.


The street pattern of Poeke has clearly expanded and the name's spelling has changed from French to Flemish but much if the town is still recognizable on the (second) 1777 map. You can also compare the windmill symbols near the top left of each map.

After I made the Poperinge map, I started looking for more interesting places, in other words places with more variety of land uses, buildings and ones that have windmills and watermills. Ruiselede has some nice patterns and two windmills.

I decided to see how this style would translate to the United States. I started with my childhood suburban home of Levittown, Pennsylvania. 

I forgot to take into account that the original project was set up using a Belgium-specific projection. This caused north to be rotated a good 50 degrees or so to the upper right. In Belgium north is at the top but after crossing the ocean the earth's curvature has rotated it this much. By the time I realized this my QGIS project was no longer opening without crashing. This is what eventually seems to happen to all of these projects so I was not able to "fix" north without starting over again. There is plenty of sprawl here but the style still makes the area look a bit quaint.

Next, I went to nearby Newtown, a place we used to go for country drives. In my youth it was a lovely country town, founded by William Penn with some nice old architecture and good ice cream. The town center is still nice but it is now surrounded by a four lane bypass expressway and bland modern housing.

I felt like Newton's street pattern might look a little more like 16th Century Belgium.

Finally, in the interest of finding a U.S. place that is more recognizable and meaningful to others, here is the western part of the National Mall in Washington, DC, including the White House, Washington Monument and Lincoln Memorial. I had a problem drawing the water in the QGIS project so I airbrushed some blue where it seemed appropriate.

I should have used more of a green patterned fill  as in the atlas image below but once again the project crashed before I had a chance to fix that.