Wednesday, May 14, 2014

Your State's Third (or Second) Language

The American Community Survey shows that English is the most commonly spoken language in all 50 of the United States. This makes for a pretty boring map. Slate has a set of maps that dig deeper into the data to see what other languages are spoken. Spanish is the second most commonly spoken language in 43 states so that map is still not very interesting. However when you remove English and Spanish and look at the third (or second for 7 states) most common language things get more interesting.
http://www.slate.com/articles/arts/culturebox/2014/05/language_map_what_s_the_most_popular_language_in_your_state.html
This type of map should be taken with some caution as the numerical differences between languages may not be very large. Also one large urban area such as Detroit, with its large Arabic population can bias an entire state. If I had more time I could look this up but I would guess that not many Michiganders speak Arabic in the Upper Peninsula, or even north and west of Pontiac. Still, it's interesting to see how some of the original settlement patterns of the US have persisted (Navajo in the southwest, German in the midwest, and pockets of French, Italian and Portuguese in the east,) while other states show more recent settlement patterns such as Filipinos in California and Nevada, Vietnamese in Texas, Oklahoma and two other states, and Korean.

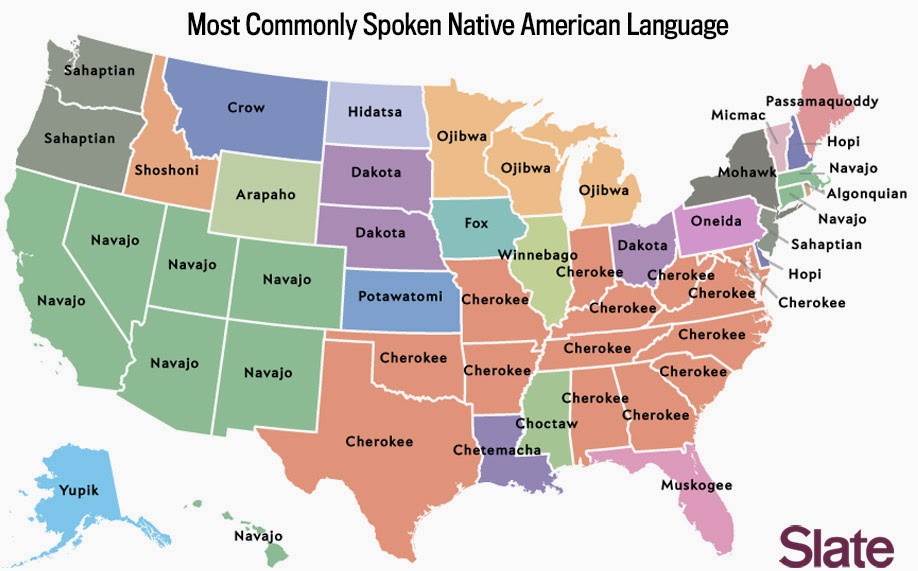
The article has several other maps showing the most common Scandinavian, South Asian and African languages. These are based on much smaller numbers so they're not as meaningful, yet there are still some regional patterns that emerge. More interesting is the map of the most common Native American language. The map mostly reflects original or sometimes forced settlement patterns, but also shows some long distance migration, particularly of the Navajos.
http://www.slate.com/articles/arts/culturebox/2014/05/language_map_what_s_the_most_popular_language_in_your_state.html
For more details and maps go to Slate.

Wednesday, May 7, 2014

Dug Tries Open Source Mapping

I was asked to make some maps showing a family's escape from Nazi-occupied eastern Europe during World War II. I've gotten used to relying on ESRI's expensive mapping software but nowadays there are many good open source tools available and many of them are platform neutral, meaning I can use them at home on my MacBook, or at work on my Windows PC or laptop. I hope to use more of these tools for personal and work projects.

I looked at some good tools for creating interactive (clickable or animated) maps, but this project only required a simple printed map. After some research I settled on the MapQuest API. This creates a map by entering a line of text in a web browser. For example this URL (the full text is below) creates a map showing the two towns in Belarus (variously under Polish, Russian and Lithuanian control at the time) where the grandparents came from.
http://open.mapquestapi.com/staticmap/v4/getmap?key=Kmjtd%7Cluu7n162n1%2C22%3Do5-h61wh&size=1200,1000&zoom=7&center=53.35,26.1&pois=yellow_1,53.219784,26.68405,0,0|red_2,53.489738,26.738491,0,0

The code above includes the image size, zoom level, center (in latitude, longitude) and two points ("pois" in the code) whose coordinates can be found by entering the name of a place or address in various online mapping services - Bing Maps is particularly easy to use to get these coordinates. The map above is oddly missing country names and needs the two points labeled. This is easy to do by saving the image and bringing it into Paintbrush, a free Mac program, or Paint if you're using Windows.
https://blogger.googleusercontent.com/img/b/R29vZ2xl/AVvXsEgXH_M_QoT9nY75Hrt8YzYJv8cKT9Ad8XOQIXQqkYvqC29SHYMMP2IfSukSLsT_9tmFTRE74GpmqyyRNyBl0UMCx3e0mVdqyzZtCyhovcZuBgUBUFYMQPR8F2ZwFy4zNDrR8vGCADudtco/s1600/Belarus5.jpg

The same process resulted in this map of five addresses in Warsaw.
The map looks fine but doesn't really tell a story. To illustrate the forced relocations and disappearing family members, I used Inkscape, an excellent free program but with a steep learning curve, to create arrows and some text effects. The bubble text was done using my Mac's native Preview app, though this can also be done in Powerpoint, Inkscape (with difficulty) and other software packages.
Click on the map above to see the entire picture or look at this detail to get the idea.
I look forward to making the rest of the maps showing the family's difficult journeys through France, Britain, Spain, Portugal, Mexico and finally to the United States. It's been a good learning experience both about the mapping tools and the horrible past that we're lucky to have escaped.

Wednesday, April 30, 2014

40 Maps That Won't Explain Anything - Part 2

Here's the second installment of 40 Maps That Won't Explain Anything - Part 1 with a snarky explanation about this series is here.

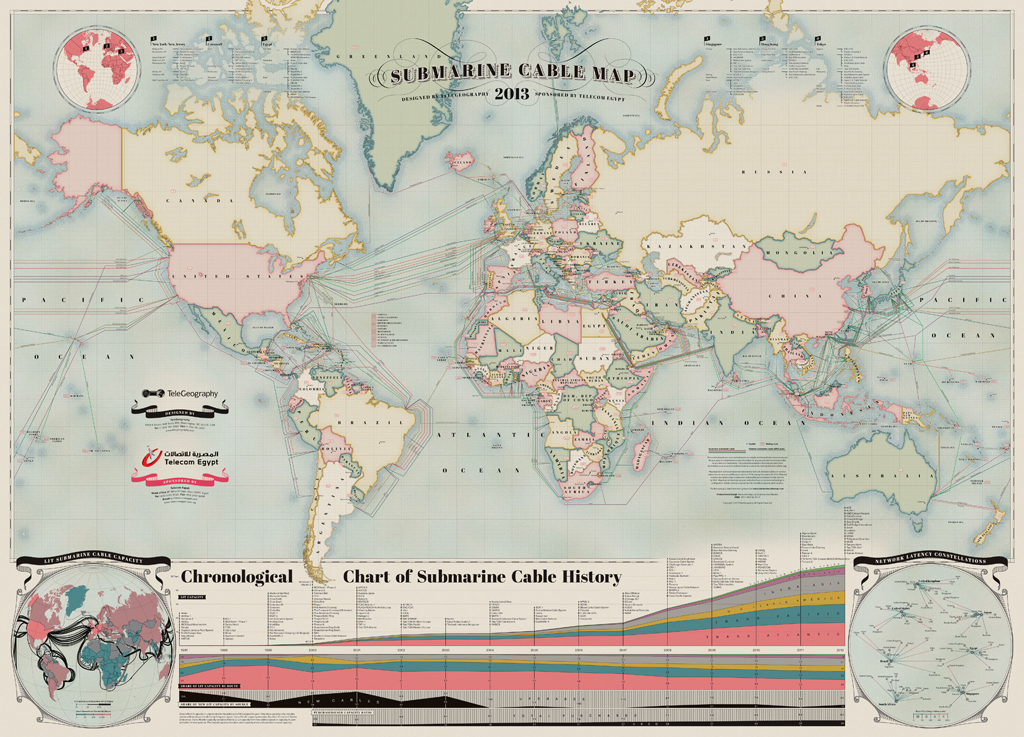
11. Hand painted map of submarine fiber optic cables. A zoomable version is here.
12. James Niehues makes pretty ski area maps. Here's Mt Alyeska in Alaska with the aurora borealis lighting up the sky.
13. Upside down 1963 Esso map for travelers going from New York to Florida.
http://imgur.com/RmpTTom
14. "Eastern Shore of Virginia - Most Fertile Trucking Area in the United States" G.L. Webster Canning Co.
http://www.lva.virginia.gov/public/archivesmonth/2005/vhs/VHS_8.htm

15. Map of San Seriffe - from a Guardian April fool's prank.
http://www.theguardian.com/news/datablog/2012/apr/01/guardian-april-fools-list#zoomed-picture
16. Majority Home Heating Fuel Type - Washington. From the American Community Survey.
17. TweetMap - heat map showing where people were tweeting using the hashtag #Phillies last summer.
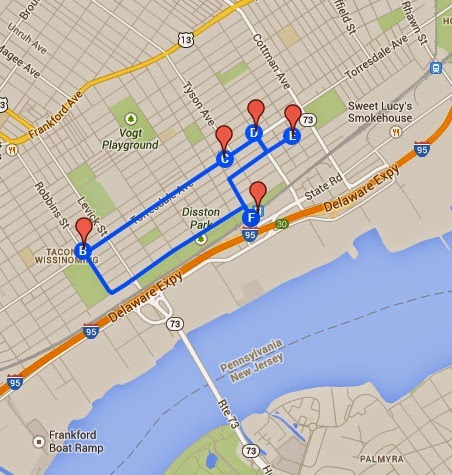
18. The Tacony Hoagie Trail in Northeast Philadelphia. Go for a healthy hike!
https://mapsengine.google.com/map/edit?mid=zhjjli_rr4GQ.kAhU8P0PgLN4
19. The Japan Railways System
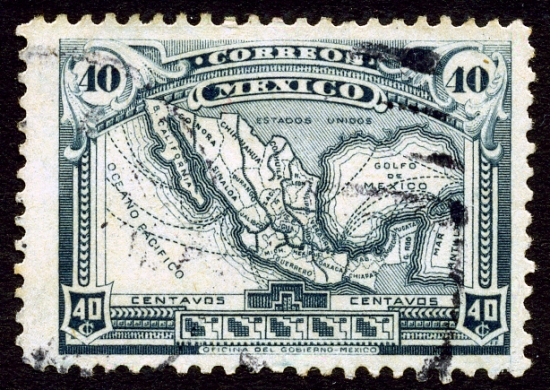
20. 1915 stamp featuring a map of Mexico


Wednesday, April 23, 2014

How Hollywood has Destroyed America

From the Concourse - an animated map showing the many ways places in the US have been destroyed in movies.
http://theconcourse.deadspin.com/map-how-hollywood-has-destroyed-america-1542969906
Hollywood clearly does not shy away from destroying their own city. The page includes lists and explanations for each symbol type along with several caveats and a discussion of the fine distinction between monsters and creatures. The yet to be released Sharknado 2 was not included. 

Wednesday, April 16, 2014

Tufte at Fermilab

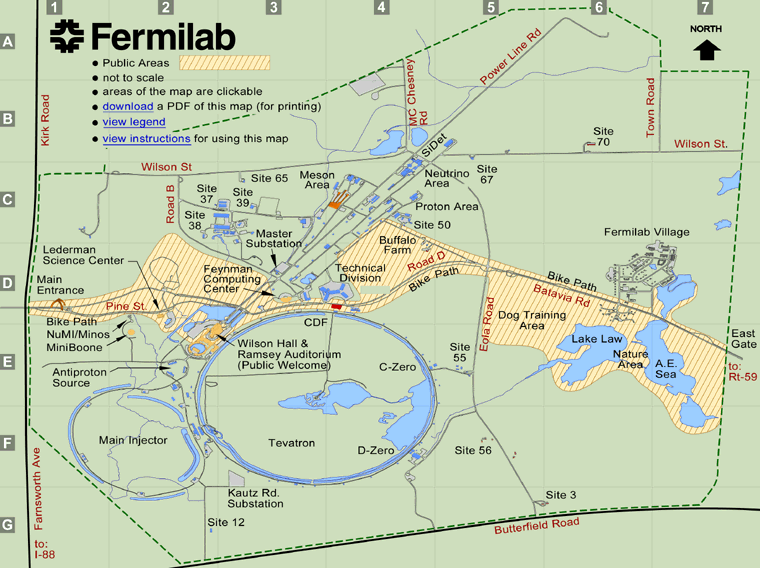
Informational Design guru Edward Tufte will be at Fermilab in Illinois tonight at a reception for the Edward Tufte Celebrates Richard Feynman art exhibit. Tufte's three dimensional steel sculptures are built in the shape of Feynman's diagrams. The Nobel Prize-winning physicist and star of the wonderful book Tuva or Bust! created these pictorial representations of subatomic particle behavior. Tufte's work emphasizes their inherent beauty.

Fermilab, like the Tufte exhibit, is an intersection of art, science and nature.   
https://www.fnal.gov/pub/visiting/map/site.html
Named for Physicist Enrico Fermi, the lab contains the Tevatron, once the world's largest particle accelerator. It is housed in a circular tunnel with a 4-mile circumference, 30 feet underground below the ring visible on the map and showing up clearly on the aerial photos. The Tevatron has been replaced by the Large Hadron Collider in Switzerland. The lab also features numerous other research facilities, bike trails, open prairie and a herd of buffalo. It shows up on aerial photography as a remarkably open space in the middle of the sprawl of metro Chicago.
The reception is from 5-7 PM tonight and there are still tickets (no charge) available. If you're in the Chicagoland area, this would be nice opportunity to meet Tufte and see the fascinating Fermilab campus.

Wednesday, April 9, 2014

Waffle House America

Last year Deadspin posted this map showing the Waffle House-IHOP version of the Mason-Dixon Line.
http://deadspin.com/map-do-you-live-in-ihop-america-or-waffle-house-americ-510668232
  mapsbynik has added to this geographical foodways discussion by mapping the density of Waffle Houses.
http://mapsbynik.tumblr.com/post/82053920556/waffle-house-density-by-quad-the-map-shown-here
The map was done by taking USGS 30x60 minute map quad sheets, overlaying them onto Google Earth, and extruding the height based on the number of Waffle Houses. More details and data by quad can be seen at mapsbynik's tumblr site. Atlanta is the home base for the chain so their dominance was expected, however the degree to which it towers above the rest of the country is truly impressive.

USGS quads are not a common unit for this type of mapping (counties would be much more typical) but the quads work nicely for the Waffle House data pattern. Because the Atlanta area is spread among numerous counties, a county map would spread the data out. This would result in more of a boring low rise edge city look than the towering skyscraper we get here.

Wednesday, April 2, 2014

40 Maps That Won't Explain Anything-Part 1

In my continuing quest to make fun of the recent plague of "40 Maps That Will Explain Everything You Ever Needed to Know and Keep Your Breath Minty Fresh" articles such as this one and this one; here are 10 maps that blissfully do not pretend to explain anything. 40 maps is a lot to digest in one blog post so I will break this out into several posts that will appear from time to time.

1. Jeep tracks around the Pink Roadhouse at Oodnadatta Australia
2. Almost unreadable map of Chicago restaurants

3. Detail from Hand Drawn Map of Berlin by Jenni Sparks
http://www.jennisparks.com/Hand-Drawn-Map-of-Berlin
4. Oregon Wine Regions using 1980's style computer graphics - somethingaboutmaps
5. The Milky Way Transit Authority by Samuel Arbesman
http://www.arbesman.net/milkyway/
6. Panama Shipping Routes from a lemon crate
http://www.antiquelabelcompany.com/store/Scenic/Great-Map-Showing-shipping-Routes-on-PANAMA-Lemon-Crate-Label-from-Santa-Barbara-California-Custom-Framed-p496.html
7. Detail from a zoning map of Minsk-the full map is here.
8. Fort Wayne, Indiana art print from Jennasuemaps
9. Forth Worth, Texas art print, also from Jennasuemaps - really you can't tell the difference?
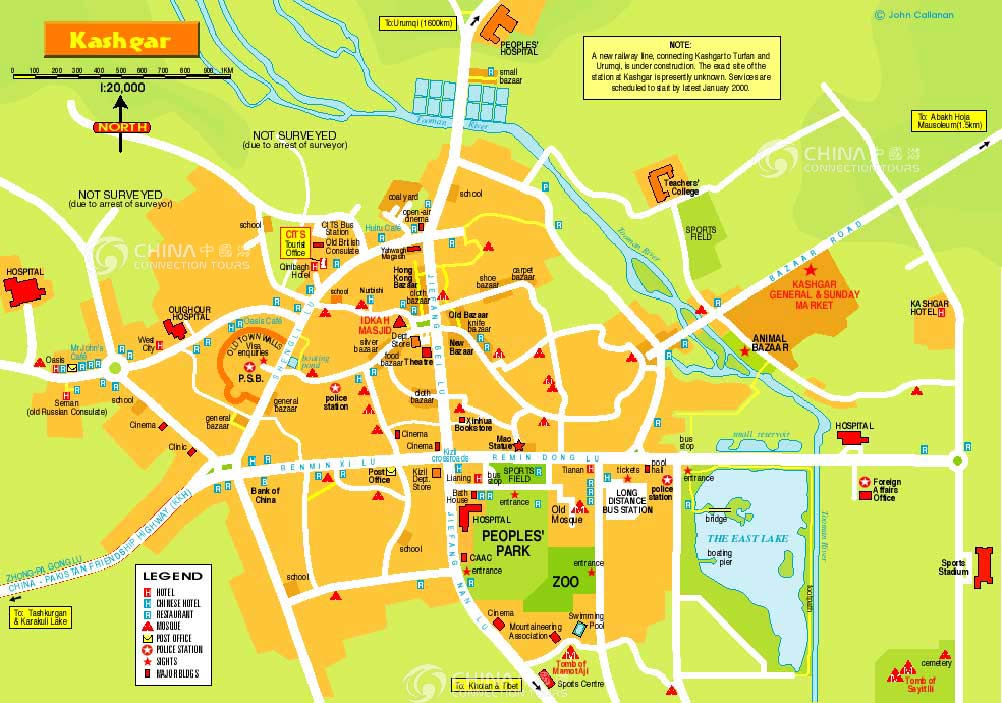
10. Map of Kashi (Kashgar) just because I've always been weirdly fascinated by the place. Note the areas that were not surveyed due to the arrest of the surveyor.
http://www.china-tour.cn/images/Kashgar/Kashgar-Map.jpg