Wednesday, October 24, 2018

The Quebec Election Cartogram

Quebec is a great use case for election cartograms. The map below (via CBC) shows how dominant the cities and suburbs are in population.
http://ici.radio-canada.ca/special/2018/elections-quebec/circonscriptions-resultats-cartes-vote-analyse-politique/
I like how they shaded the shape of the Province behind the hexagons. The geography be unrecognizable without it. The map at the bottom of their page illustrates how one Riding (district), Ungava covers over half of Quebec's area but contains a similar population to a tiny Riding in Montreal.
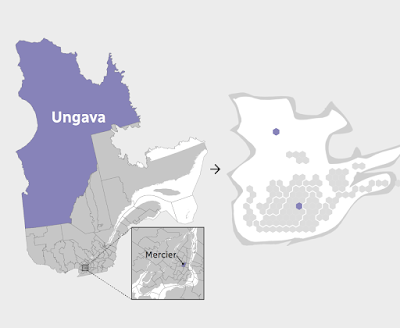
http://ici.radio-canada.ca/special/2018/elections-quebec/circonscriptions-resultats-cartes-vote-analyse-politique/
In the recent election the conservative Coalition avenir Quebec (CAQ) made huge gains at the expense of the Liberal and Québécois parties. Here are before and after maps. I rearranged the from the side by side view on CBC because the layout of this blog makes it easier to read this way.
Light blue is CAQ, dark blue Québécois red is Liberal and Orange is Québec Solidaire, another party that saw gains in this election. Above is before and below after the election.
Here is the side by side images as they appear on the CBC web page. The comparisons are easier to make when not distracted by the giant low density areas of northern Quebec.


Wednesday, October 17, 2018

Ghastly Halloween Poster Maps

What, where, why? It all started with a software tutorial using data from upstate New York. GIS software packages tend to open with random color schemes. When I brought the data into GlobalMapper, it gave a nice orange and black Halloween palette - the orange below got browned a bit when by Twitter.

Looking around the area I decided that the Syracuse street pattern provided nice, creepy look for a Halloween poster - I will put some boring technical details about the process for these at the bottom so you can skip that part if not your thing.

Next, I thought about spider webs and looked for a city with a nice, webby street (or highway) pattern. San Antonio works-when looking at the regional highway network.
Here's a final one - another S city inspired by my childhood skeleton costume.
Enjoy!

Technical details:
Each map was done using a very different process. For Syracuse I downloaded data from OpenStreetMap, styled it in QGIS using a fiery pattern, then exported an image which I altered using a ridiculous combination of GIMP, Inkscape and Photoshop. If I knew those packages better I could have surely done all that in one but I used the bits and pieces I know from each. I used an online font generator for the title and then styled and altered it a bit in Inkscape.

For San Antonio, instead of downloading the data, I made a screen shot from OpenStreetMap and then used Photoshop to select and remove certain colors, then manipulated it in Inkscape with various spider web pattern fills.

Seattle was mostly done in Photoshop by manipulating layers and tracing the major roads from a screen shot with bones. The background is a knee x-ray image that I smudged to fill in the non-knee-like areas of the city like West Seattle and Magnolia.

Thursday, October 11, 2018

Cha if by Land, Tea if by Sea

There's a very interesting post on Quartz, titled Cha if by Land, Tea if by Sea: Why the world only has two words for tea. Actually, its only one word, represented by the Chinese character 茶. This character is pronounced in most of China as "chá" but in the coastal provinces where the Dutch traded, it is pronounced "te". The Dutch brought tea back to Europe on ships where variations of the word were spread, while overland trade to other regions led to variations on chá, such as chai.

https://cms.qz.com/wp-content/uploads/2018/01/tea-map1.png?w=2520&strip=all&quality=75
The map above was clipped to fit this page better. To see the entire image with legend and credits click on it. Blue dots are variations of "te" based on the Min Nan (south coastal Chinese) dialect while magenta dots are variations of Sinitic (common to most forms of Chinese) dialects. There are a few scattered gray dots where other local words are used. These are mostly in native tea growing regions, where the crop developed independently.

 Countries along the Silk Road trading routes, as well as parts of East Asia and East Africa have "chá"-like words for tea while most of Europe uses "te"variations. Eurpoean exceptions include Portugal, whose trade was conducted through Macao, where chá was used, the Basque region, possibly due to proximity to Portugal, and parts of Eastern Europe where trade was likely to have been from overland routes.

For New Zealanders, who may be upset at the omission from the original map (wider maps show up less clearly in this format), here you go:
 

Wednesday, October 3, 2018

The Wealth of African Cities

Africa's economy is growing rapidly as are its cities. Population projections for 2100 show Lagos. Nigeria becoming the world's largest "megacity" with a population reaching over 88 million. This video shows the predicted top 20 cities in 2100, the top three will be in Africa. A map, via Visual Capitalist shows where private wealth is concentrated on the continent.
http://www.visualcapitalist.com/map-cities-hold-africas-wealth


Wednesday, September 26, 2018

Huge North America Pictorial

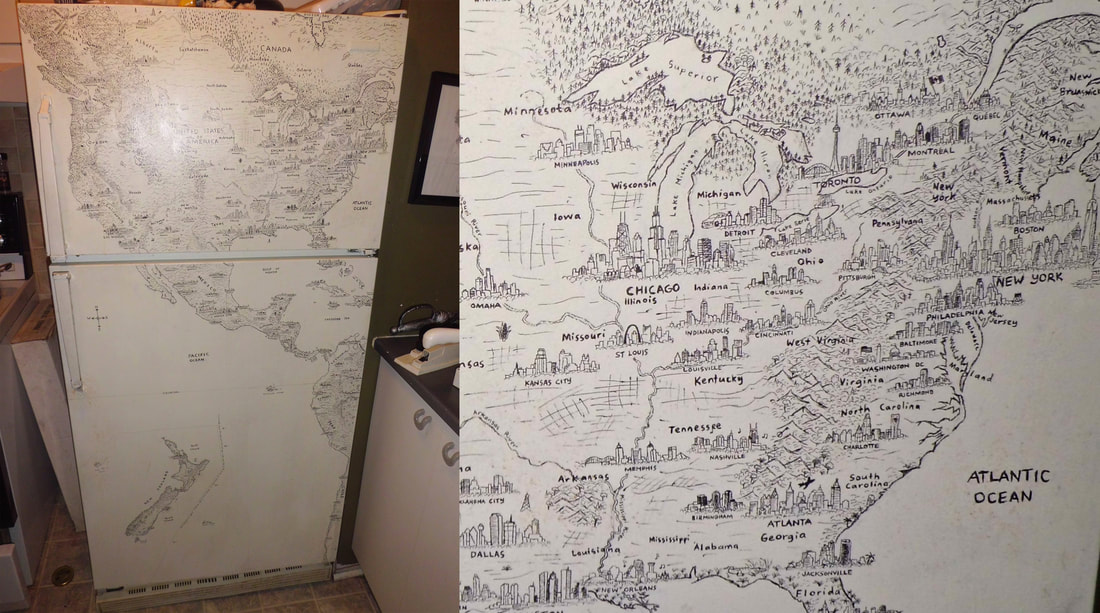
Last night, thanks to the Leventhal Map Center in Boston, I had the opportunity to see Anton Thomas discuss his amazing map project that has been four years in the works.
We all got to look up close at a copy of the map (from stitched together photographs of the original) as seen above. Magnifiers were also provided.
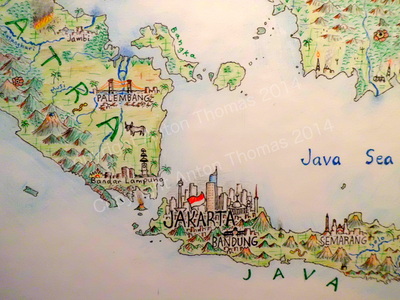
The photos above were taken with my phone under poor lighting conditions. Here is a detail from his web page to get a better sense of the map.
https://www.antonthomasart.com/the-north-american-continent.html
The project started with a drawing on the refrigerator in his apartment in Montreal. He recently visited and confirmed that the fridge is still there though it barely works.
https://www.antonthomasart.com/uploads/3/7/0/5/37051787/h-fridge-montreal_orig.jpg
Before embarking on the current map he did one titled South Asia and Australasia.
https://www.antonthomasart.com/uploads/3/7/0/5/37051787/8899799.jpg
There are lots of amazing details including the cityscapes, flora and fauna and music and he spent a ton of time researching each place. Below the Chicago skyline there is a guitar with music coming out of it - specifically the notes and rhythm of "Sweet Home Chicago."
Here is a picture of him showing a collection of bears and moose that he drew in various locations.
One of his challenges is what to do when an area is devastated by an earthquake. Here is Haiti with some of the major buildings of Port Au Prince ghosted in.

If you're interested in digging deeper, here is a video where he describes his process.

Thursday, September 20, 2018

Earth Animations

Earth is a project from Cameron Beccario showing a wide range of climatic conditions that can be animated. Here are the winds animated from Hurricane Florence as it made landfall on September 14th.
At the same time an even more intense Typhoon Mangkhut battering the Philippines.
You can choose to look at air or ocean currents, waves, water and air temperatures (at different heights)  and various other factors. You can even switch map projections. Here are ocean waves using the Waterman Butterfly projection,
and ocean currents in the North Atlantic, looking very Van Gogh-like.
Data are from various global sensors, the geographic data comes from Natural Earth. The visualizations are created in the browser using javascript programming. The color schemes are intuitive enough that no legend is required. Here is the three hour precipitation accumulation over North Carolina from the hurricane.
Another option is the probability of seeing an aurora.
Explore more here


Wednesday, September 12, 2018

Boston's Highway Dreams

Recently I went to a meeting at the public library in Medford, Massachusetts. With some time to kill beforehand, I browsed their map collection and came across this atlas put out by the state (excuse me, Commonwealth) in 1962.
It shows the existing and proposed highways. Here is an optimistic assessment of the reduction in travel times that would result from the proposed expressways.
The green lines are the travel times in 1945 while the red lines are the forecasted times in 1975 after the highway system was expected to be complete. Dotted gray lines are the proposed highways, most of which were never built due to a combination of powerful local opposition and budget constraints. Note how the red lined areas expand along these corridors. With or without expressways the notion of getting downtown within 15 minutes from most of the area below is very quaint.
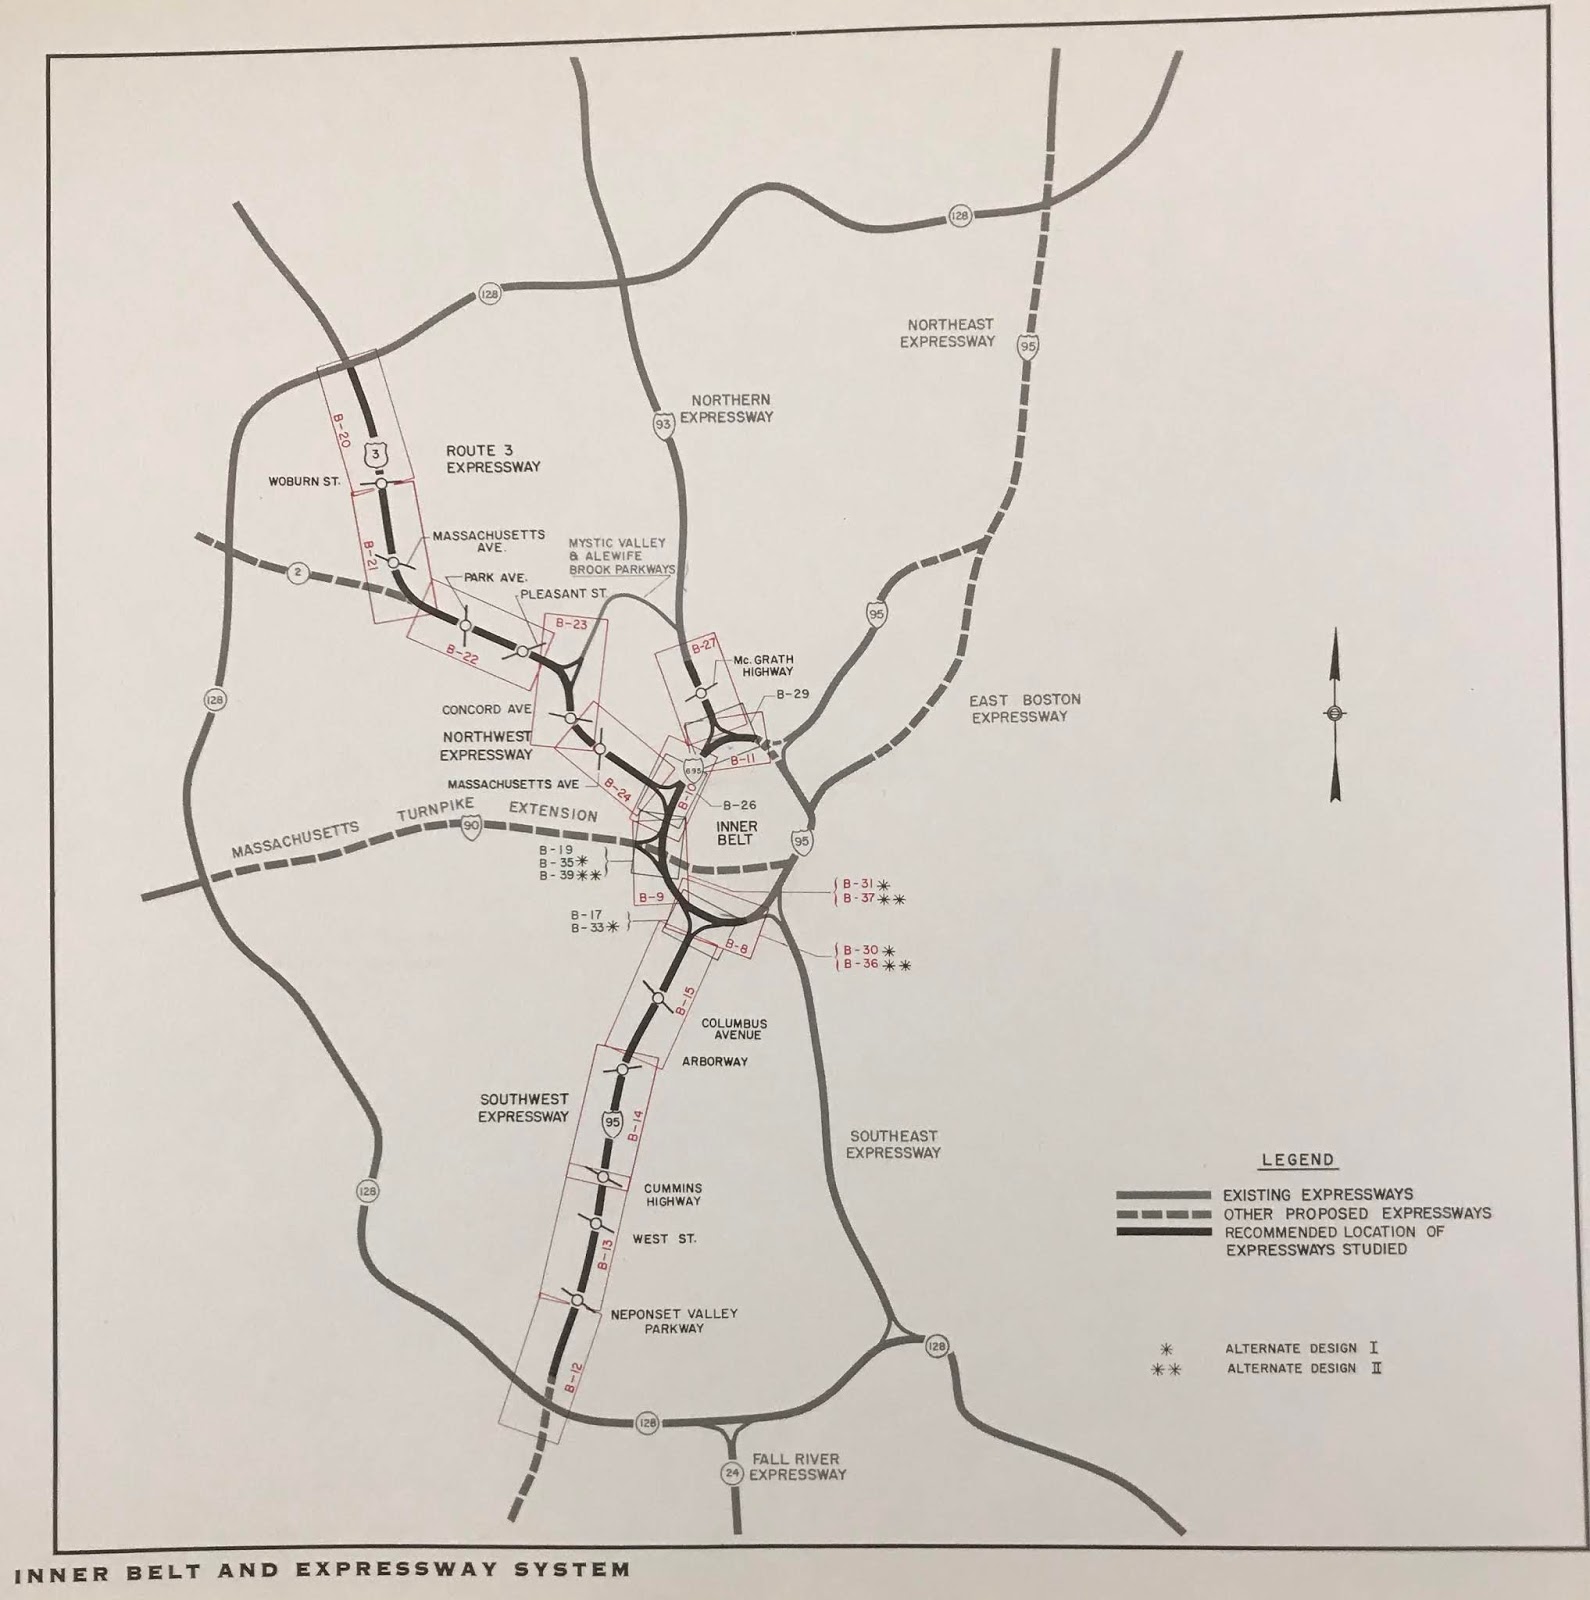
The plans included a central ring, the Inner Belt or Interstate 695, that was to be built through neighborhoods of Boston, Brookline, Cambridge and Somerville. There were also proposals for a northwest expressway connecting Route 3 to I-695 and one for the Southwest Corridor alignment of Interstate 95.
Much of the housing along the Southwest Corridor was cleared for the highway by the time the project was cancelled. This land was repurposed for a linear park with a transit route for the MBTA Orange Line and Amtrak's Northeast Corridor. Yes, the Southwest Corridor became part of the Northeast Corridor. Here is a detail showing an area of Roxbury that would have been traversed by I-95.
I'm not sure what the orange-green color scheme is for but it clearly shows how the neighborhood would have been split - like an Atlantic Record.

Here is the interchange between 95 and the Inner Belt. This map has south at the top so it's disorienting. Even more so because so much of this neighborhood was wiped out without the highways being built.
Finally, a detail that hits close to home because it is close to my home - the never built Northwest and Route 3 Expressways.