Wednesday, January 25, 2023

Taiyoh Pokemon Nation

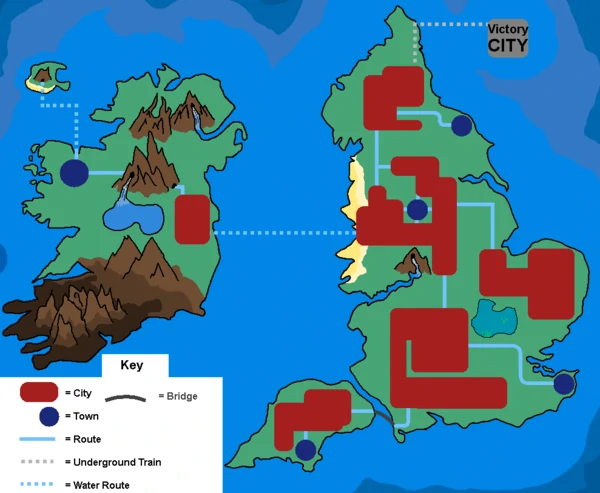
Taiyoh is a fan-made Pokemon nation. It is based on Japan. In fact, the resemblance is so strong that I came across these pages when looking for maps of Japan.

I will refrain from commenting on Pokemon given my lack of knowledge. However, I like the look and feel of this map. It's nice to see fantasy maps that aren't obvious attempts at stealing the Tolkien motif. Here is a close-up of the Kanto region, the capital located and shaped quite a bit like Tokyo Bay.


Looking at the author's Lunos nation, there's a definite style to his cartography.

Finally, here's the Karai Region.

 I can't quite place it but these shapes seem a bit familiar too.


Wednesday, January 18, 2023

The Inequalities of Climate Change

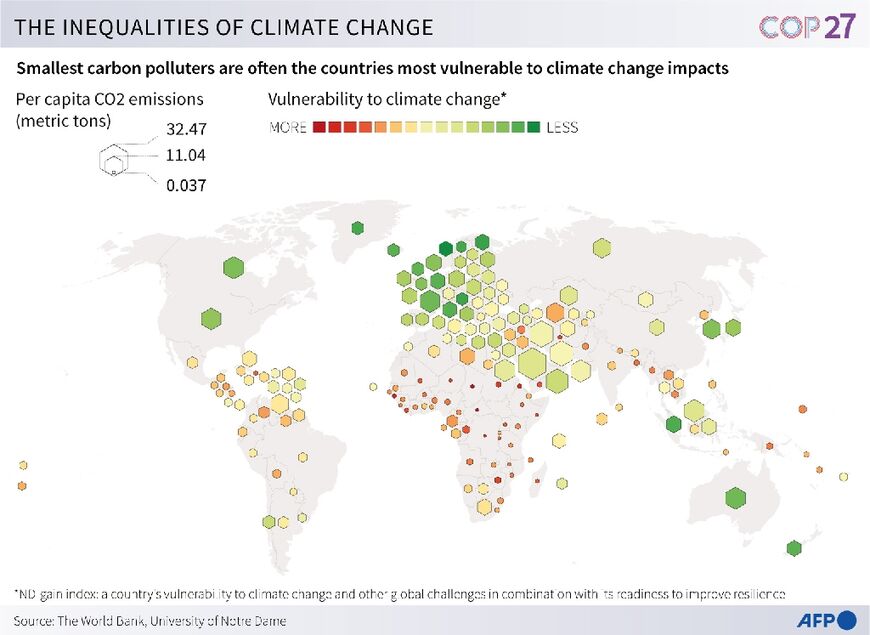
There was much talk, if not much action, at the recent COP27 conference about wealthier countries compensating poorer ones for the impacts of climate change. The poorer countries see the largest impacts, while contributing the least to the problem. This map illustrates the problem well. Unfortunately, I could not find a clearer version of it-this one is from Al-Monitor

The larger hexagons show higher per capita carbon emissions while the redder colors represent vulnerability to climate change. 

There is another version of the map via Arab News-this one has a truly bad and confusing color scheme (the "more" colors should be reversed) but the text is identical. In other words, read this map for the details but use the other one to see the pattern-this one just muddies the message.


Wednesday, January 11, 2023

Artwork of Mary Edna Fraser

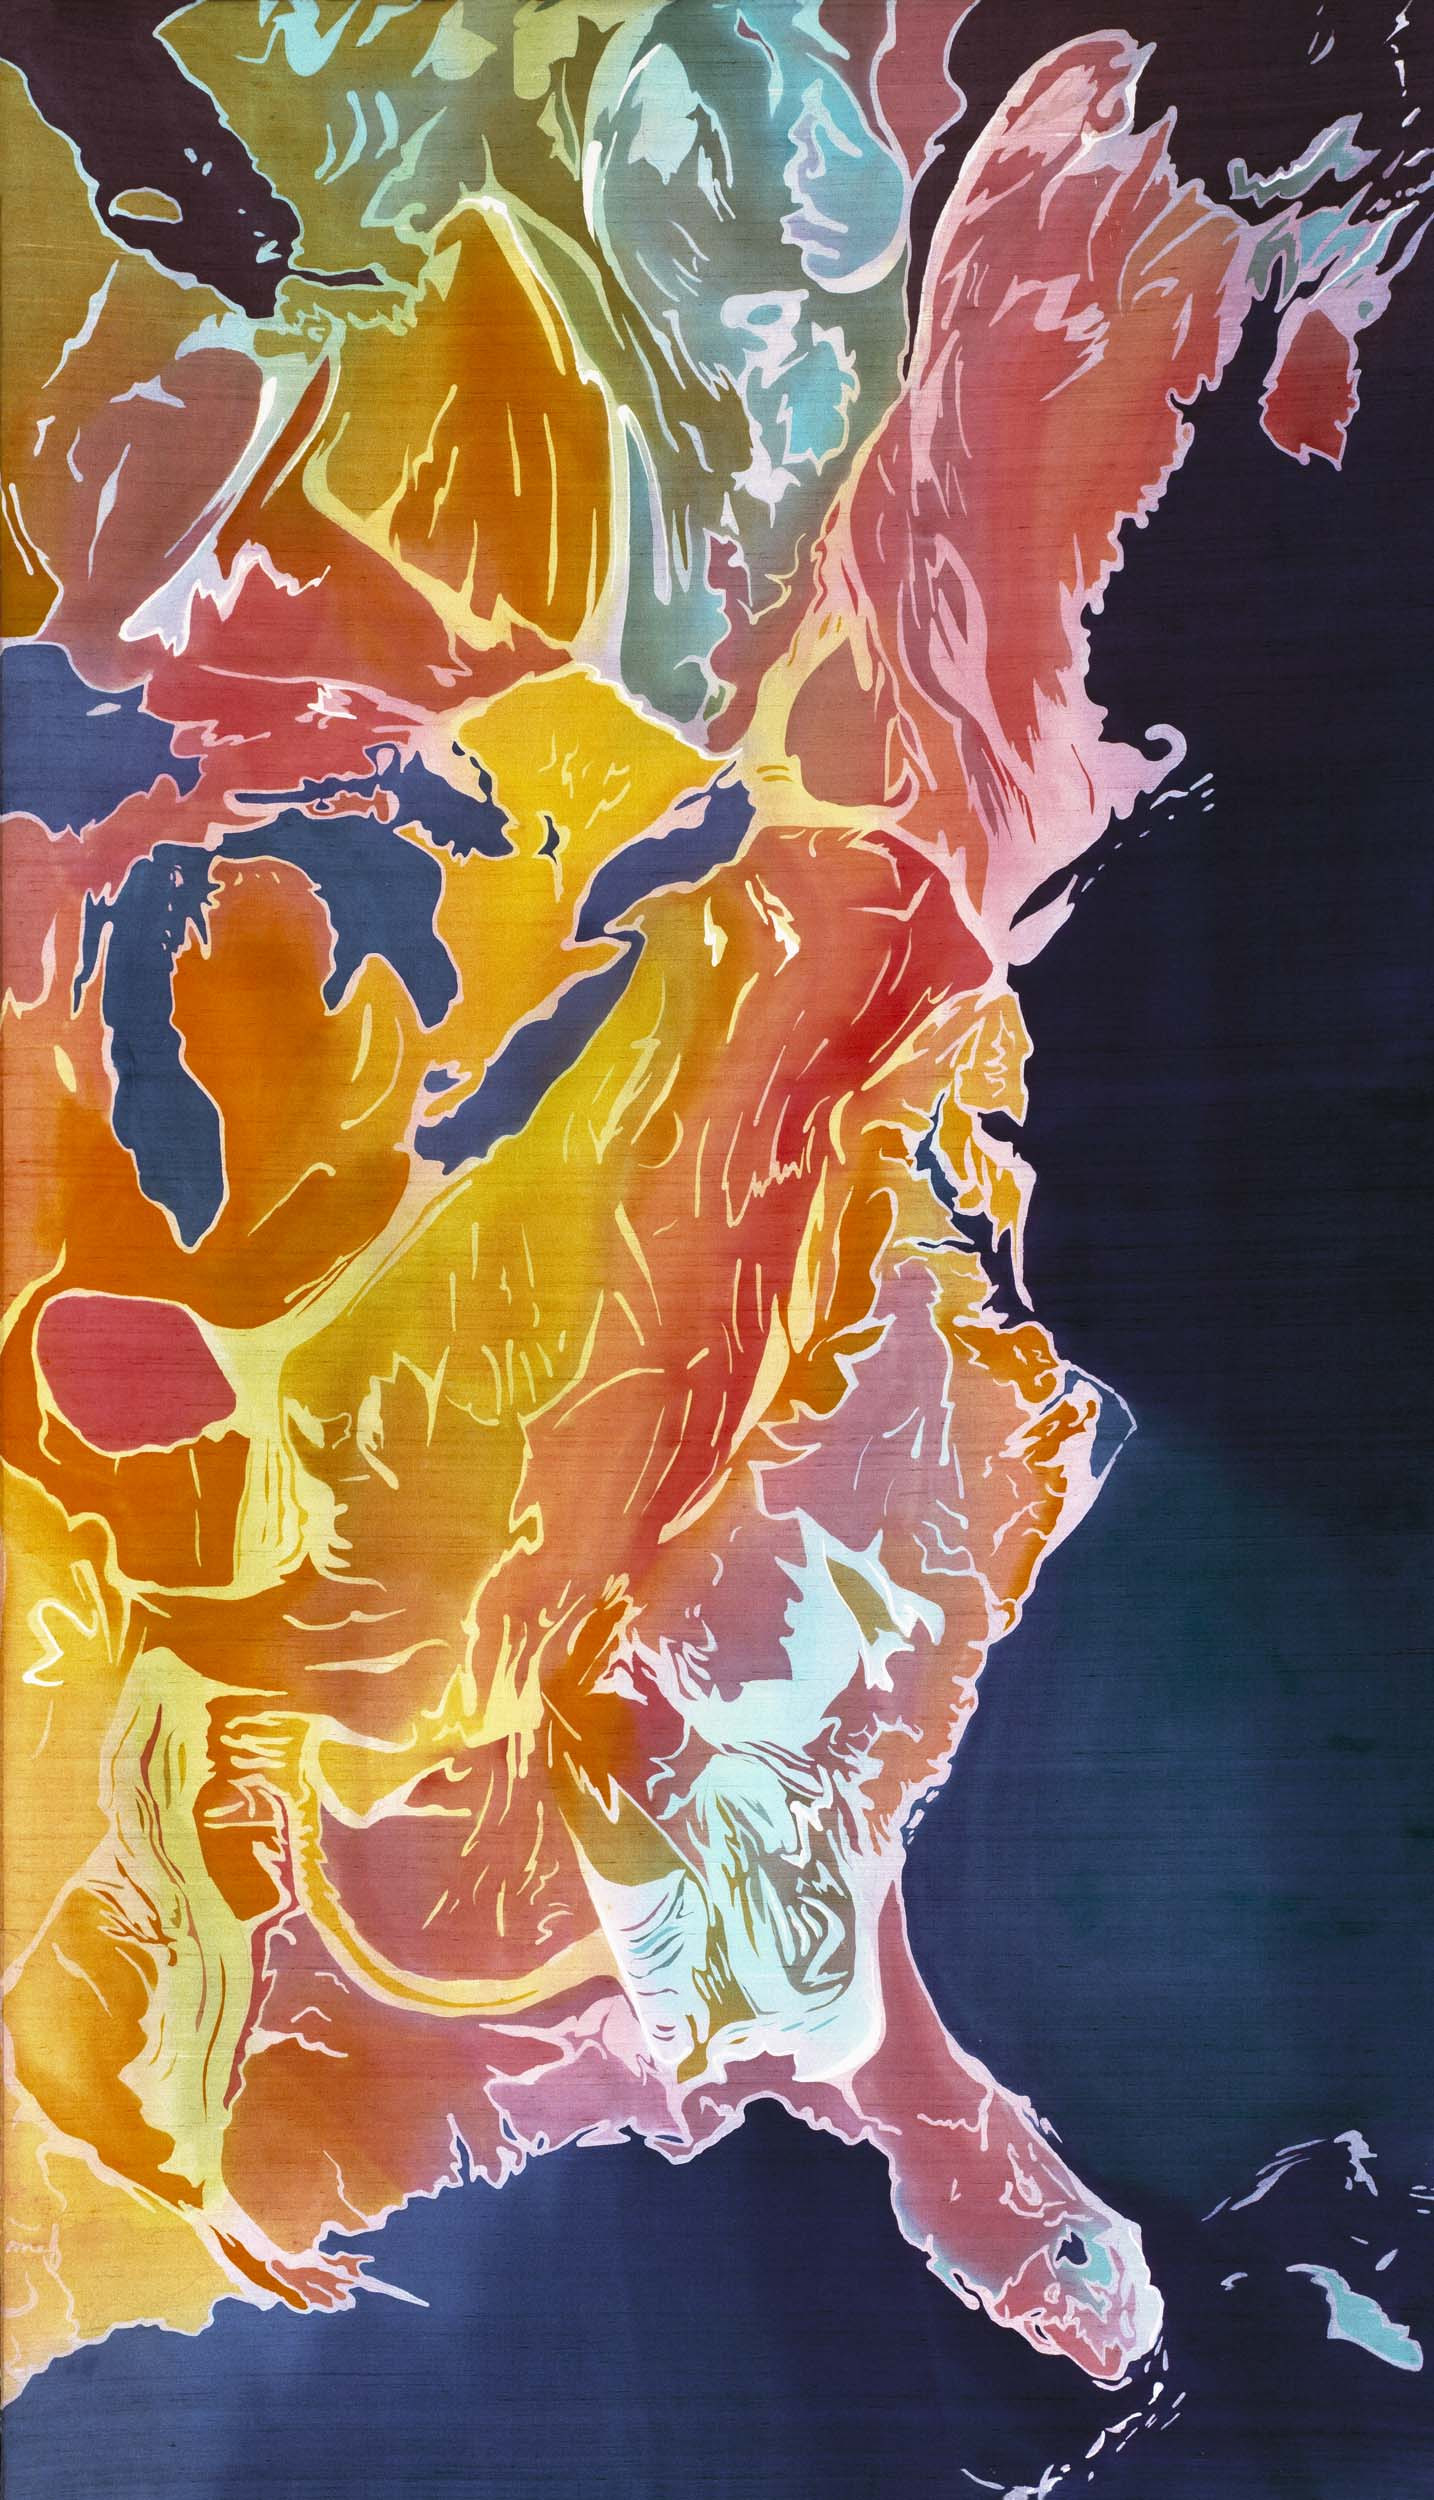
Those who have read this blog over the years know that I love the intersection of art and cartography. One of my recent discoveries is artist Mary Edna Fraser. Her textile work (from silks to rugs) and paintings range from the continental scale,

East Coast, US-batik on silk

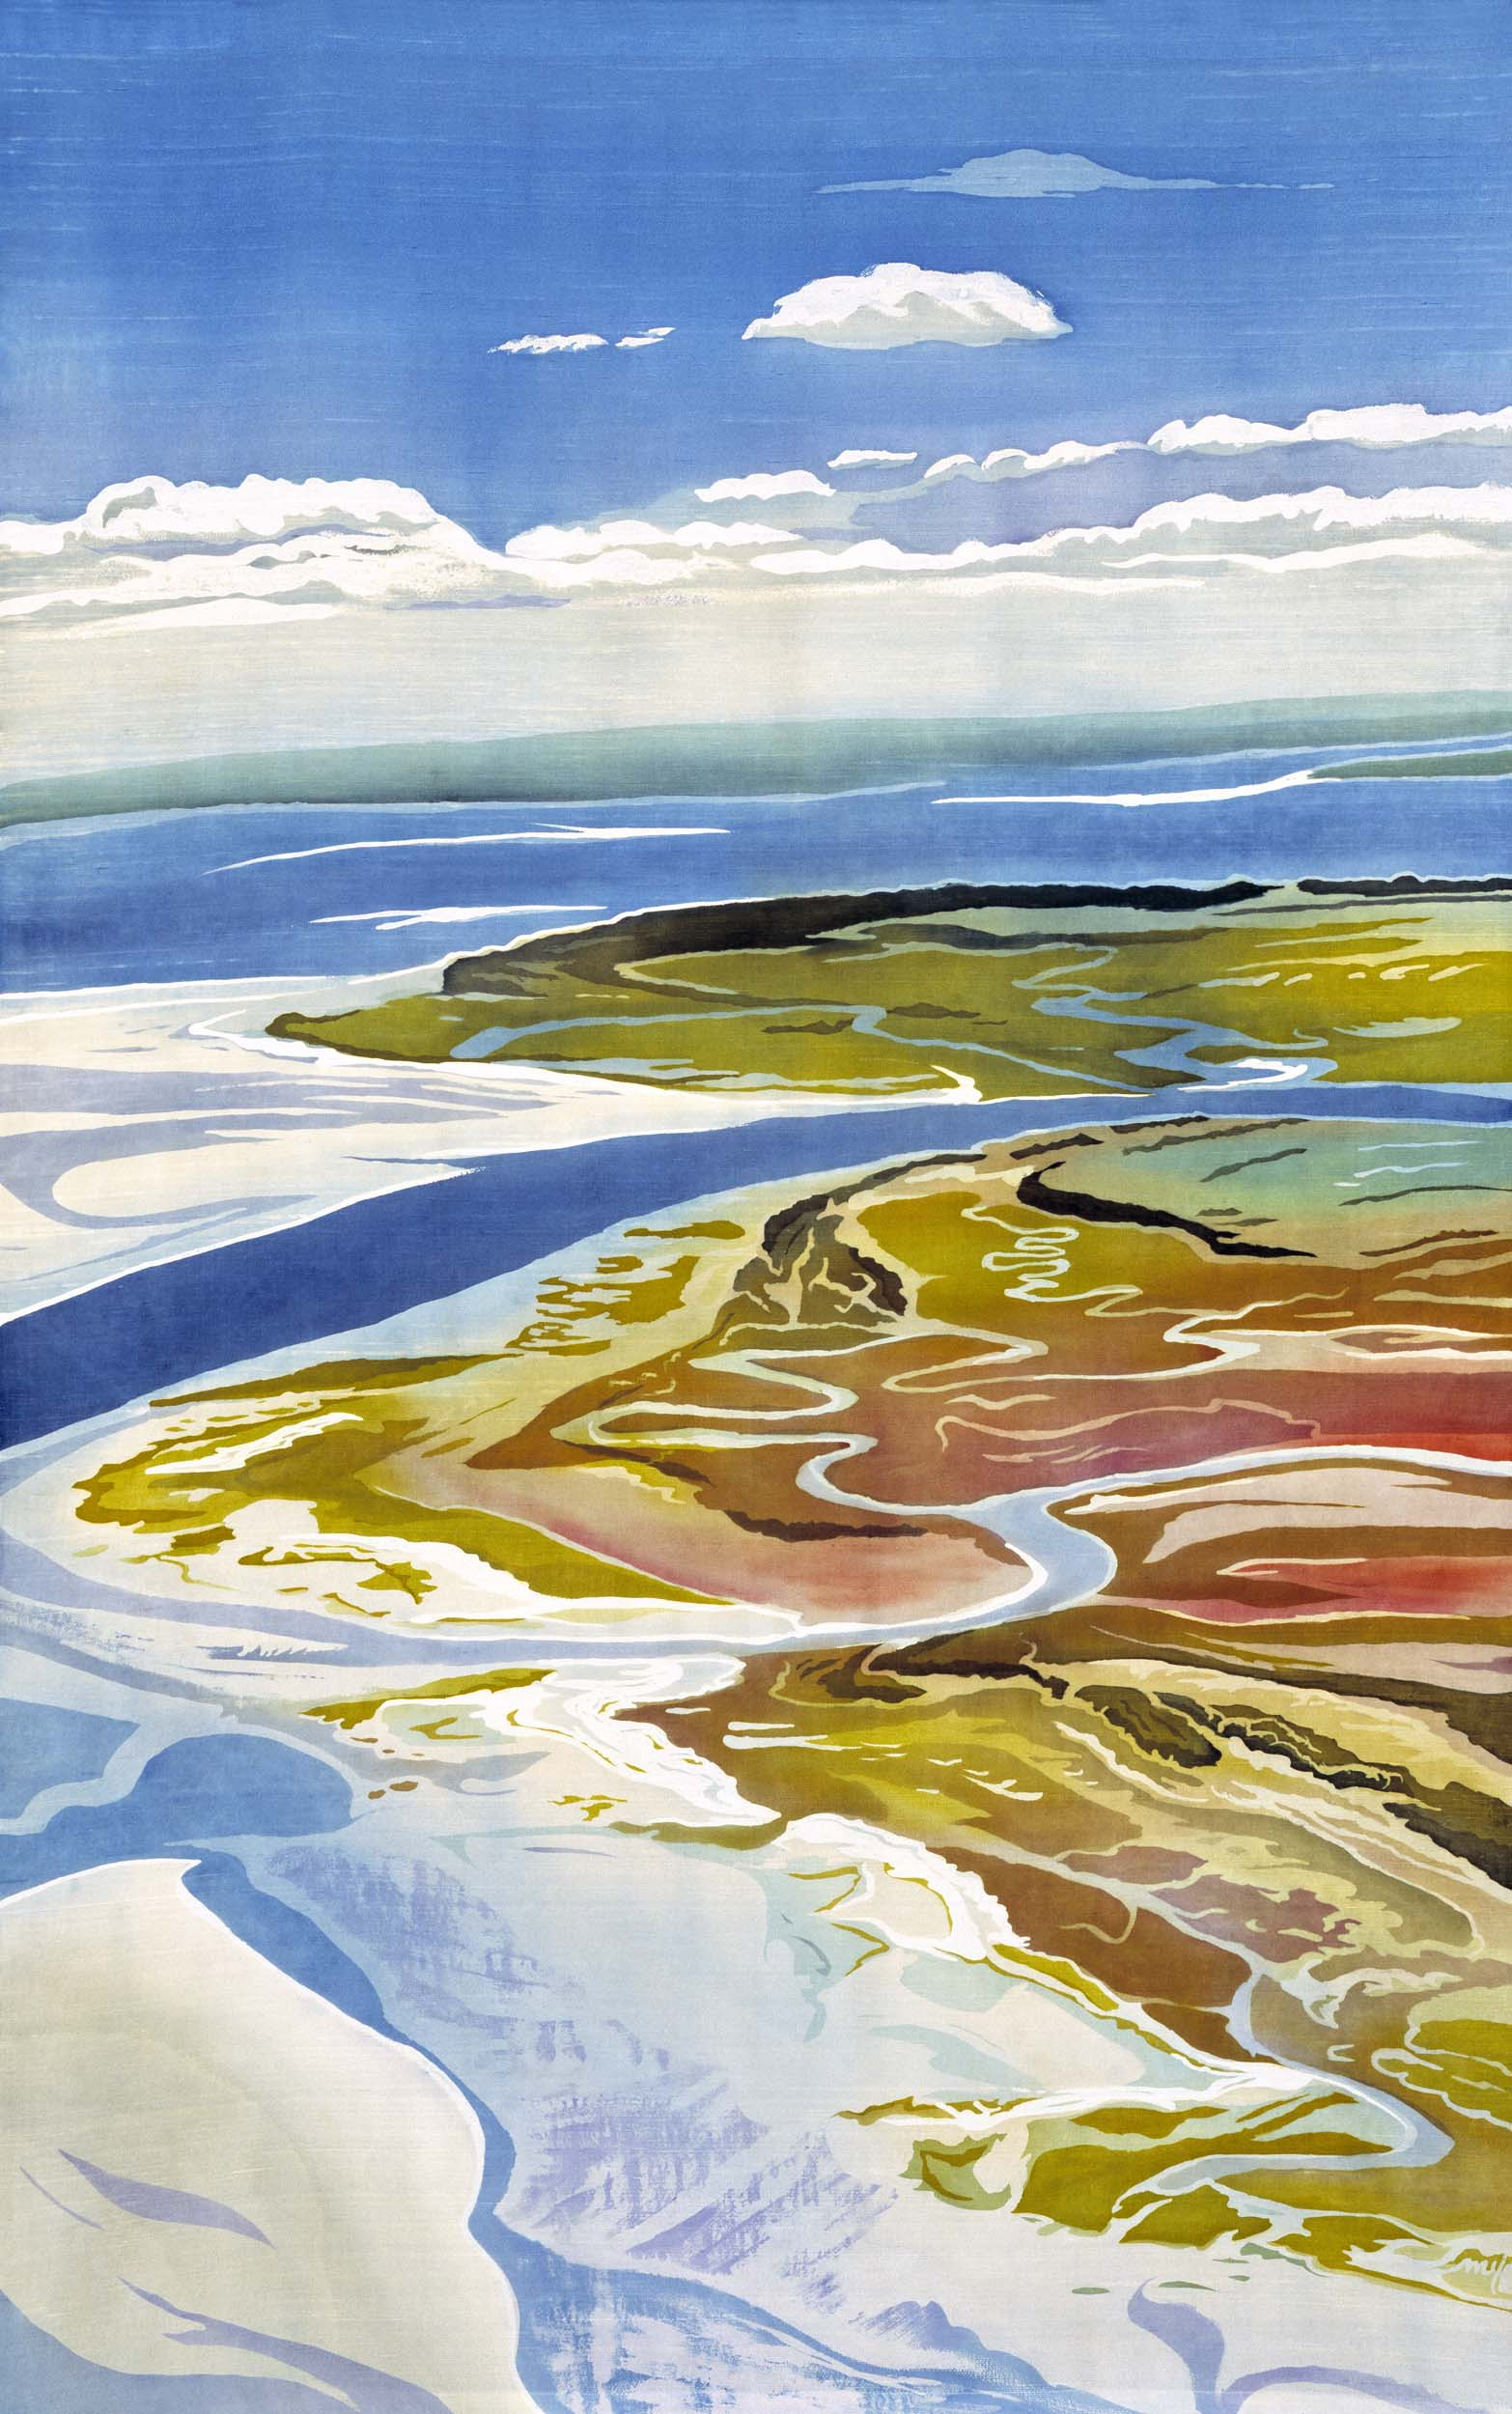
to the local scale.  

Edisto (South Carolina) -Batik on Silk

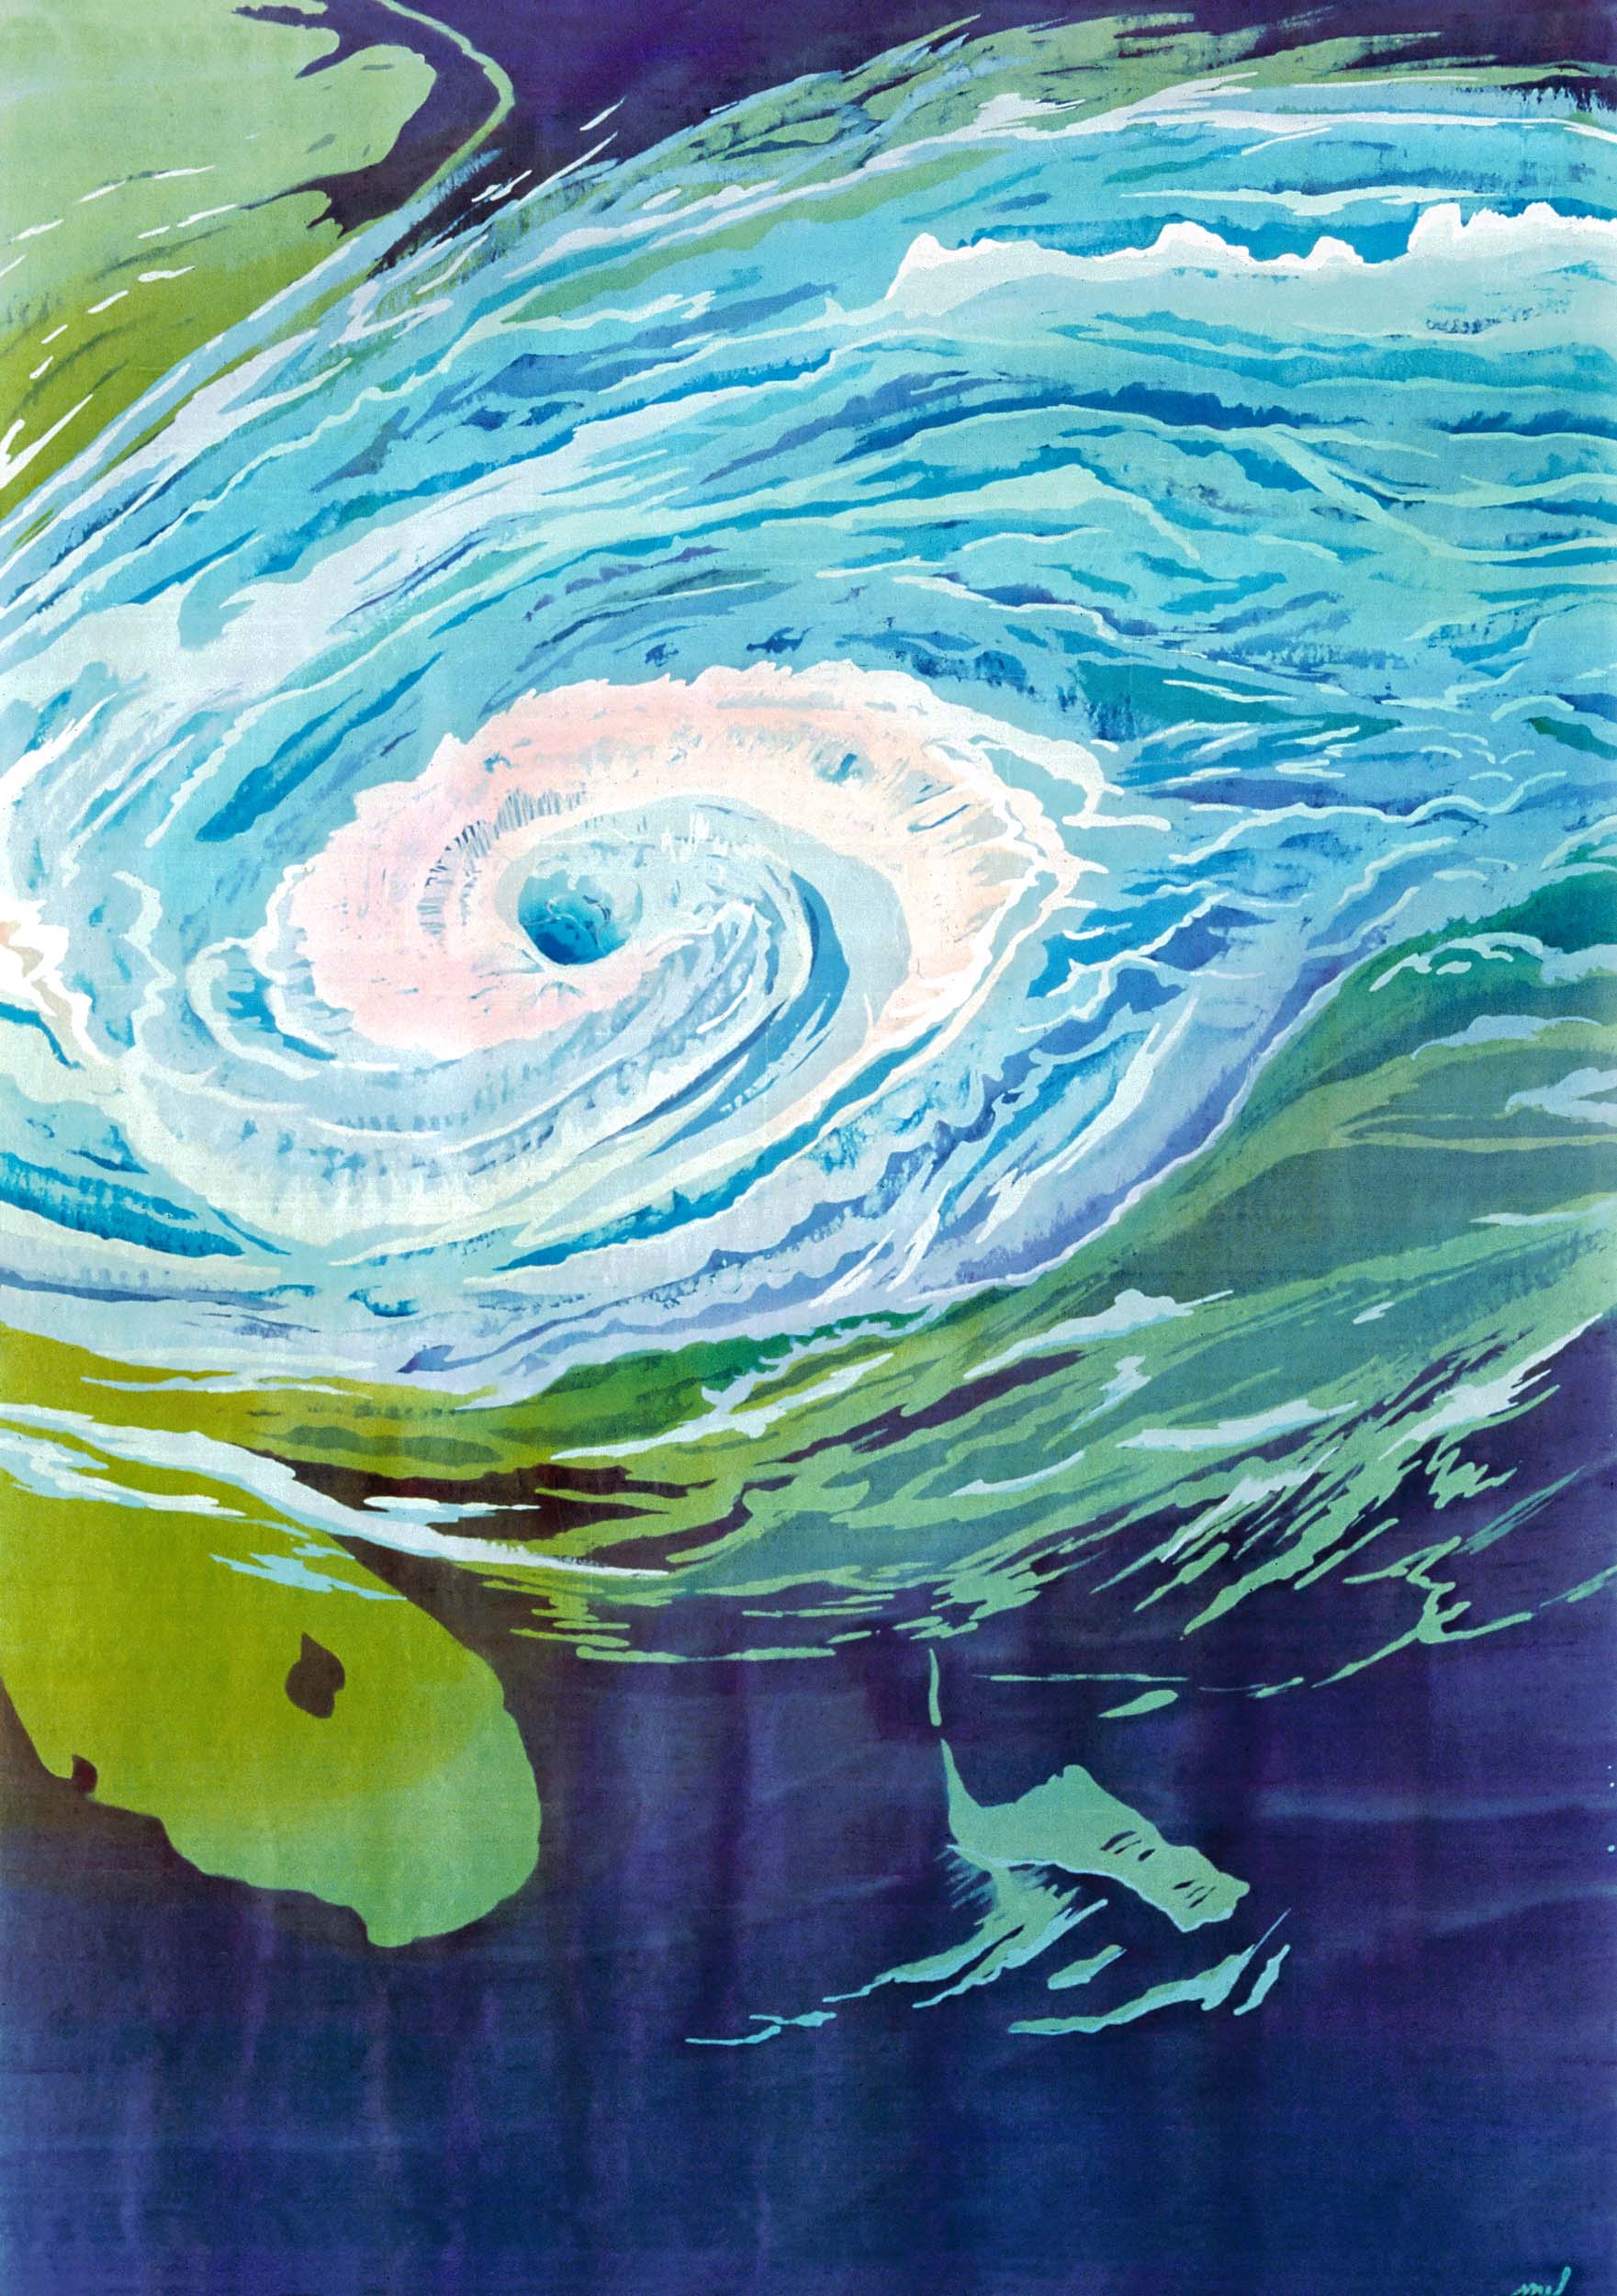
She has done some stunning works depicting hurricanes such as this one

Hurricane Season-batik on silk
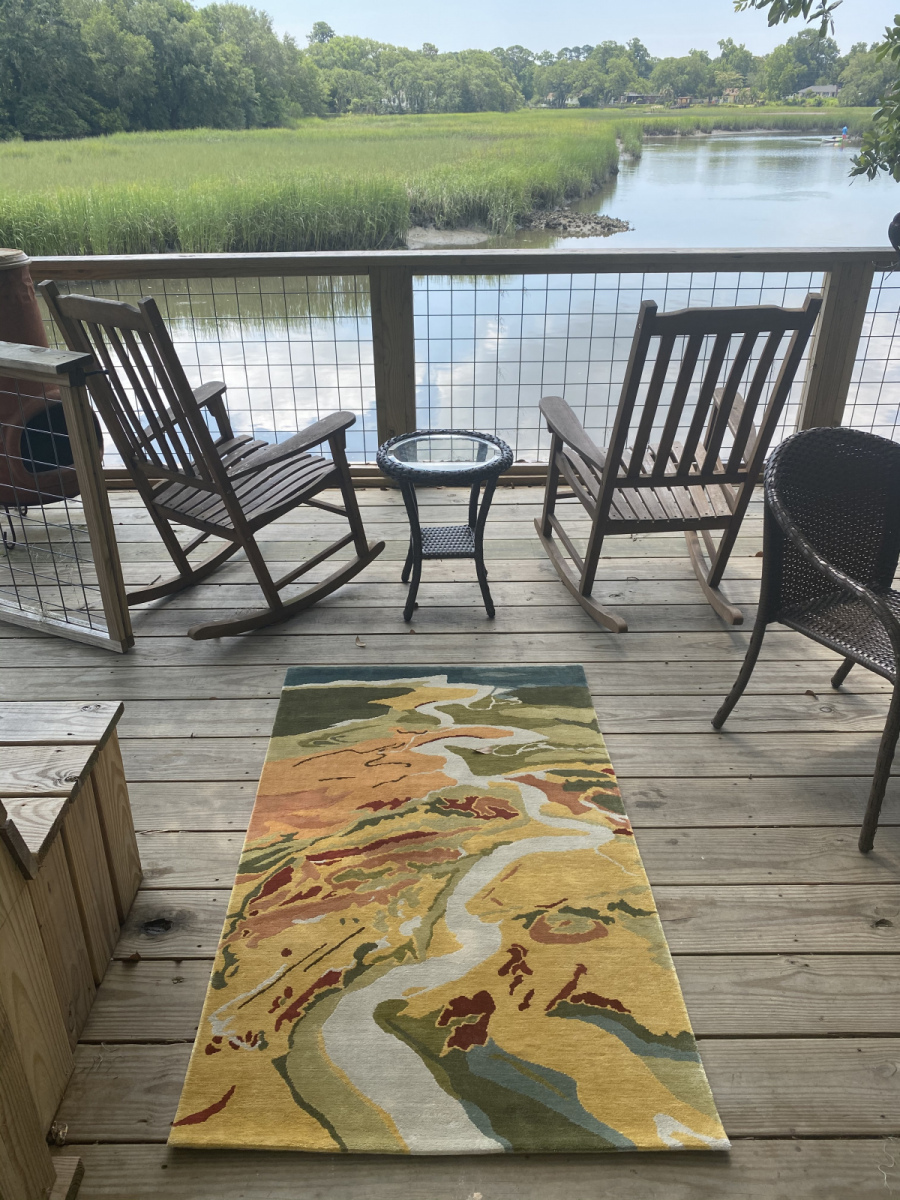
Her rugs are also very nice.
Ashley River

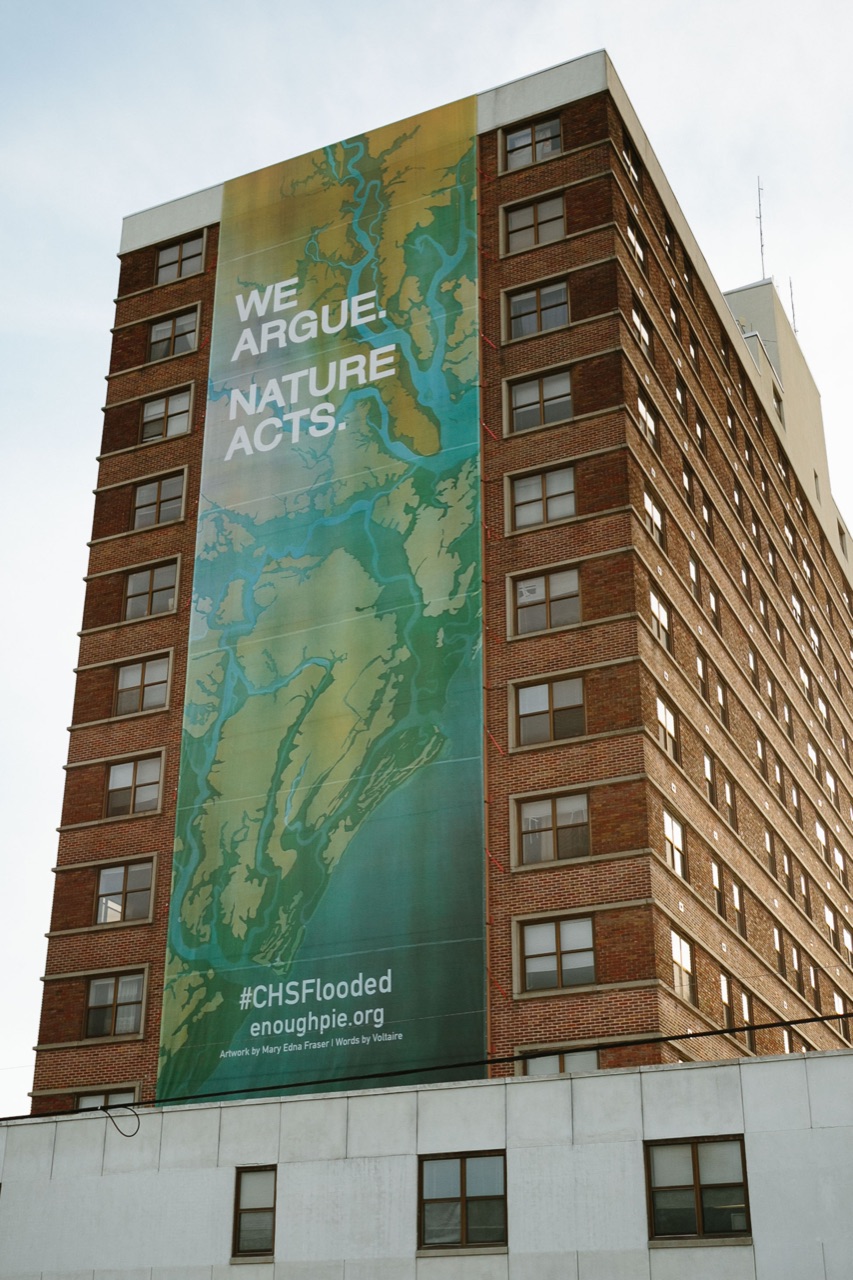
She helped organize a civic art and event-based discussion on rising sea levels that included this banner hung on the Joseph Floyd Manor in Charleston, South Carolina showing NOAA predicted flooding in the area.

Her work has been commissioned by government agencies, non-profit organizations, universities, hospitals and other companies around the world. Her main artist page is here where you can get lost in the wealth of examples.

Wednesday, January 4, 2023

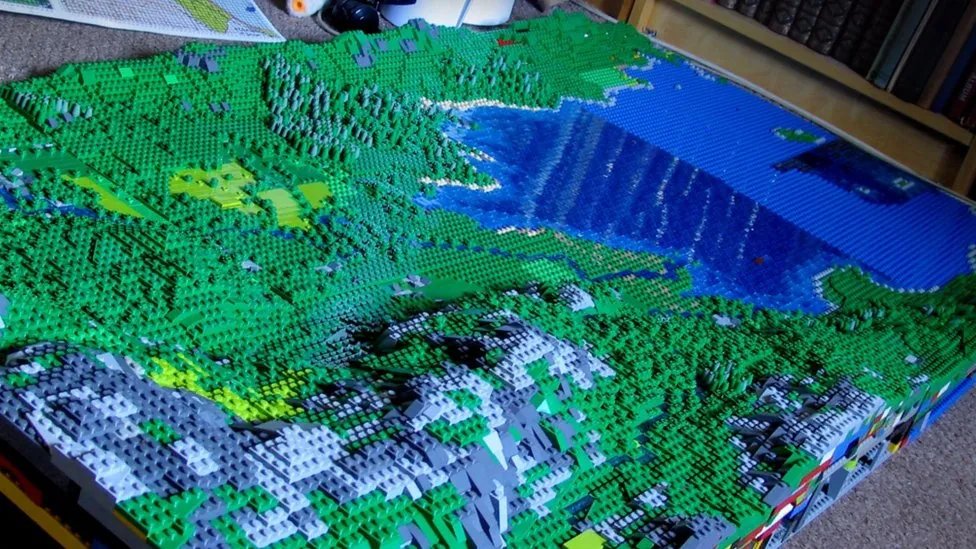
Huge Lego Model of the Lake District

Artist Jon Tordoff has made a 100 square foot, 200,000 piece (so far) Lego model of England's Lake District.

via Getty Images
 The model began as a pandemic recreation map of Buttermere, his favorite spot. 

"Now I've come over the Honister Pass, up Borrowdale and I've got Derwent Water heading towards Keswick now in the next valley," he said.


The model will be displayed at the Belper Library in Derbyshire (just north of his home in Milford) on January 6th and 7th.

All quotes and images taken from this BBC article where you can read more.


Wednesday, December 21, 2022

The 2022 Hurricane Season

While I was busy obsessing over my 30 Day Map Challenge in November, CNN put out this map in a summary of the 2022 hurricane season.

It's interesting to see all the hurricane tracks on one map. While the season started out slowly, it finished with several memorable storms including Fiona, the strongest storm to ever hit Canada; Nicole, the first November hurricane in nearly 40 years and Ian, the most destructive storm of the year. Ian's huge rainfall amounts led to many deaths by drowning.

The full article can be seen here.
 

Wednesday, December 14, 2022

The Climate Impact of Your Neighborhood

This latest New York Times interactive map shows how people who live closer in to city centers have a relatively small carbon footprint, while those who live further out have some of the largest footprints in the nation.

While that may not be surprising by itself there are some other interesting takeaways from the article (you may be interrupted by their paywall if not a subscriber). One is that even in very dense neighborhoods like Manhattan's Upper East Side the climate footprint can be above average because wealthier people "fly more, have bigger apartments and buy more stuff"

Another interesting factor is how zoning restrictions have pushed people out of these denser neighborhoods into exurbs where they are forced to drive more and increase their carbon footprint. 

Another takeaway is that even when people drive in dense neighborhoods, they tend to drive fewer miles to get where they need to go. Finally, the article gives "props" to lower emission suburban areas like Aurora and Joliet in Illinois that have good transit and shopping options.


Thursday, December 8, 2022

Mauna Loa Lava Maps

 Sure, there are cool livestreams of the Mauna Loa volcano you can watch, but even better, you can see live maps of the lava flow.

Here is yesterday's status map from the U.S. Geological Survey

The dark red in these maps shows the new lava flow from the last 24 hours. It is moving very slowly towards the main highway, mostly due to breakouts of lava upstream. The NOAA observatory has been inaccessible. For comparison, here is the November 29th map, two days into the first eruptions.

There is also an interactive map where you can zoom in and really see the details.