Wednesday, October 29, 2014

Airline Timetable Maps

Airline Timetable Images is a remarkably comprehensive collection, compiled from the collections of Björn Larsson and David Zekria. I have wasted many hours looking through their collection at vintage airline maps for example, Air Zaire, 1978.
http://timetableimages.com/ttimages/zaire3.htm
 The maps range in style from this highly schematic, barely legible 1970 Air Canada map,
http://timetableimages.com/ttimages/ac/ac70.pdf
to this geographically detailed schedule from Regie Air Afrique with artistic flourishes,
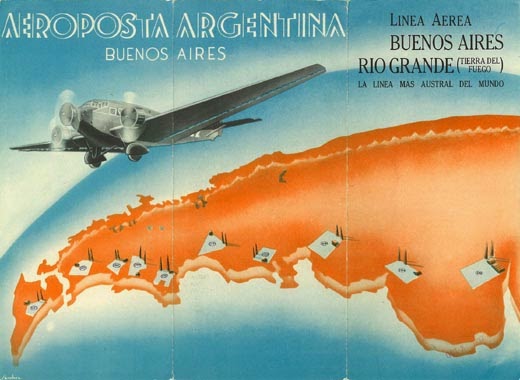
to this artistic take from Aeroposta Argentina from 1937 featuring a curved, oblique view showing airports(?)  with their hangars and radio towers, or are those trees? 
Click the image for a larger view.
http://timetableimages.com/ttimages/complete/aeropa/aeropa-1.jpg
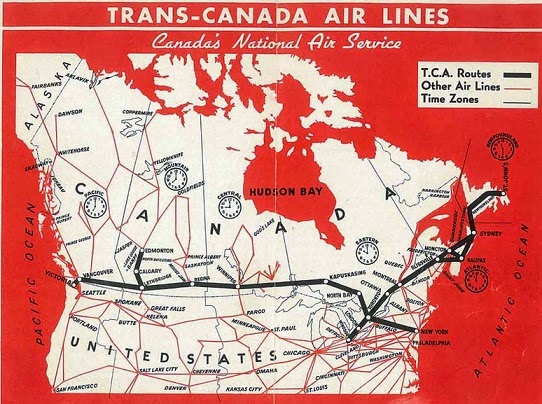
Air Canada's maps were not always this schematic. Here's what it looked like in 1945.
http://timetableimages.com/ttimages/complete/tc45/tc45-1.jpg
My first airplane trip was in 1972 on Eastern Air Lines, from Philadelphia to Houston with a change in Atlanta. Looking at their map from that year confirms that Atlanta was clearly their hub.
http://timetableimages.com/i-df/ea7209i.jpg
My memories from that flight were the breakfast sausage (we didn't get that at home) and thinking "we must be over Alabama now so those must be the covered wagons" - I had a little confusion as a child about where and when covered wagons existed.

Here is one of the oldest maps from Eastern - 1933.
http://timetableimages.com/ttimages/ea3307a.htm
I wanted to show a current map for contrast but there are not many on the site to choose from. Here is a 2010 map from Emirates with the familiar spiraling lines coming out from the hub (Dubai). This map features an overabundance of detailed topography. The mercator-like projection may be helpful for showing the large number of northern European destinations but also uses way too much map space on Siberia and northern Canada. The map also shows how much more important Toledo (Ohio, not Spain) is than you ever thought possible.
http://timetableimages.com/i-df/ek1003i.jpg
Try this at home! You might find a timetable or map for some of your flights.

Wednesday, October 22, 2014

Crowdsourced Mapping Helps Fight Ebola

Ten years ago this month Google acquired a mapping company called Where 2 Technologies and began to create Google Maps. Despite the tremendous growth of Google Maps over the last 10 years, there are still areas that are poorly mapped. When Doctors Without Borders wanted maps of the areas in Guinea, Sierra Leone and Liberia that are most affected by Ebola, they turned to OpenStreetMap, a worldwide, crowdsourced mapping project. A recent article from Fast Company Labs details how the Humanitarian OpenStreetMap Team (HOT) has gotten volunteers to quickly map cities like Gueckedou in Guinea. This image compares the level of detail between the two mapping services.
http://www.fastcolabs.com/3037350/elasticity/inside-the-crowdsourced-map-project-that-is-helping-contain-the-ebola-epidemic
OpenStreetMap is on the left, Google Maps on the right. The limitations of this blog page make this hard to see so I manipulated the images to compare them up and down.
Andrew Buck, A volunteer with HOT is quoted in the fastcolabs article as saying that Google's business model is selling advertising and “Starbucks isn't paying for Google to advertise over there so there's very little incentive for Google to improve its maps.”  

In fairness to Google, the OpenStreetMap for Gueckedou much less detailed than Google before the HOT team got mapping.
Since March the team has mapped over 8 million objects. The article has a nice animation showing the edits made in West Africa in the last six months. I was not able to it reproduce here but you can see it on their page.

OpenStreetMap has helped relief efforts by identifying unknown villages, sorting out similar village names, coordinating logistics and allowing relief workers to predict the paths used by infected persons and therefore areas that are more likely to be in need of aid.

Wednesday, October 15, 2014

Flying Map Cancels Soccer Game

A drone carrying a flag that features a map of "Greater Albania" flew over the pitch in Belgrade during the Serbia vs. Albania Euro 2016 qualifying match. One of the Serbian players pulled the flag down, resulting in brawls among the players and fans and the game was subsequently canceled.
http://www.dw.de/albanian-pms-brother-arrested-as-euro-qualifier-with-serbia-abandoned/a-17996531
My quick assumption was that this was a map showing Albania united with Kosovo, an independent republic still claimed by Serbia. However, the shape is completely different. After some digging I came across a map of Greater Albania that explains the shape.
http://www.novinite.com/articles/122305/%27Greater+Albania%27+Enjoys+Massive+Support+in+Kosovo,+Albania,+Macedonia
Not only do the Greater Albania supporters want Kosovo but also large chunks of Serbia, Macedonia, Montenegro and Greece. Good luck with that!

More details on the soccer (football) story here.

Wednesday, October 8, 2014

Melbourne After Dark

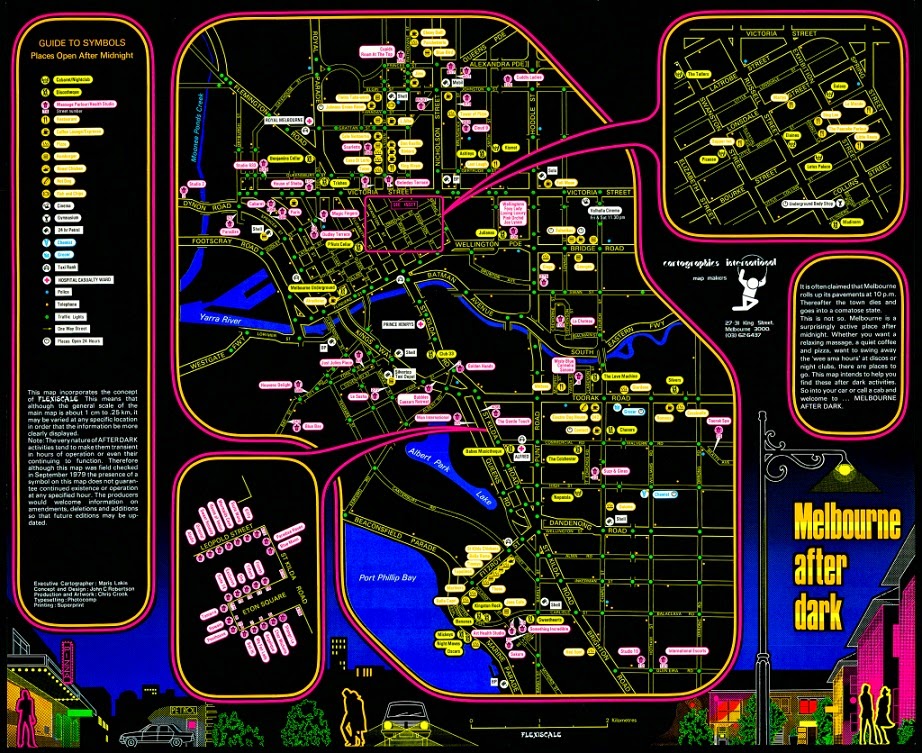
The International Cartographic Association (ICA)'s Commission on Map Design has been posting a map every day this year to highlight examples of great map design. Here is just one of the many maps worth highlighting - there may be more to come as time allows. This is a 1979 map by Cartographics International showing what establishments were open at night in Melbourne, Australia. These color choices were designed to be read at night under the street lights, while also creating a night-time look.
http://mapdesign.icaci.org/2014/06/mapcarte-176365-melbourne-after-dark-by-cartographics-international-1979/
The detail provided on the ICA page shows a happening neighborhood full of places to eat, "massage parlour/health studios" (pink lanterns) and coffee shops. The full map has a couple of areas blown up and pulled to the side, the lower left one appears to be a red light district. The bottom of the map shows some nightlife images that add to the exciting and vaguely sinister feel of the map.
http://mapdesign.icaci.org/2014/06/mapcarte-176365-melbourne-after-dark-by-cartographics-international-1979/
For a good writeup and the original images take a look at the ICA's page from June 25th.

Wednesday, October 1, 2014

Draining California

National Geographic has an article about the California drought in the October issue called When the Snows Fail. The magazine comes with a fantastic pull-out map showing the natural and manipulated ways that water flows out of the Sierra Nevada into the Central Valley, the heartland of US agriculture.
#
The printed map sprawls across several flaps and shows a broad view of the entire regional water system in a way that can't possibly (or legally) be shown here. The image above gives an idea of much of what is shown on the map including aqueducts  (light blue lines), agricultural areas in green, dams, reservoirs (with information about  percentage above or below capacity) and various other bits of textual information.

Their web site has an interactive graphic that captures some of the map's information. Click on the second tab for the graphic, the first one is the article. The graphics do a nice job of showing the flow of water from the headwaters of the Rubicon River, near Lake Tahoe, into reservoirs, lakes, the American and then Sacramento Rivers. Three years of drought have left dry shorelines, lower volumes of surface water and increased use of wells causing subsidence of the land. 
http://www.nationalgeographic.com/west-snow-fail/
The interactive web graphics are very well done, but also are a good illustration of how computer images still cannot provide the awe inspired by a large paper map. I highly recommend getting a hold of the magazine and taking a look at the full "centerfold."