Fifty years ago, on April 4th, 1968, after the assassination of Dr. Martin Luther King Jr., Washington D. C. erupted with several days of rioting. The Washington Post has an excellent story with pictures videos and maps. Here is an animated map showing incidents as reported by the Secret Service.
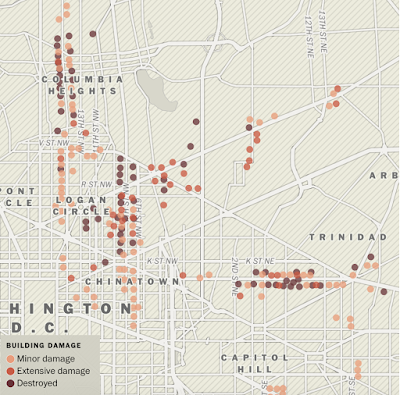
This map shows the overall amount of destruction. I altered the original image slightly to show the legend.
Here are the two maps above overlaid.
There are also a few detailed maps of the major corridors where destruction took place showing individual buildings using the same color code. This one shows 7th St NW.
Here is a tweet from Lauren Tierney, Graphics Reporter at the Post about the design process. The color scheme replicates the original map.
Also, one for the north arrow.
This map shows the overall amount of destruction. I altered the original image slightly to show the legend.
Here are the two maps above overlaid.
There are also a few detailed maps of the major corridors where destruction took place showing individual buildings using the same color code. This one shows 7th St NW.
Here is a tweet from Lauren Tierney, Graphics Reporter at the Post about the design process. The color scheme replicates the original map.
The design inspiration came from this National Capital Planning Commission map of building damage in the city. Particularly the rotated D.C. #northisasocietalconstruct pic.twitter.com/GDEKtoD56I— Lauren Tierney (@tierneyl) March 28, 2018
Also tried to match the style of the north arrow between old and new. pic.twitter.com/LAOYh6YiUr— Lauren Tierney (@tierneyl) March 28, 2018


No comments:
Post a Comment