
One of the best visualizations that I missed in 2019 was this one showing the threats to sea turtles in the Aegean Sea by Jonni Walker.
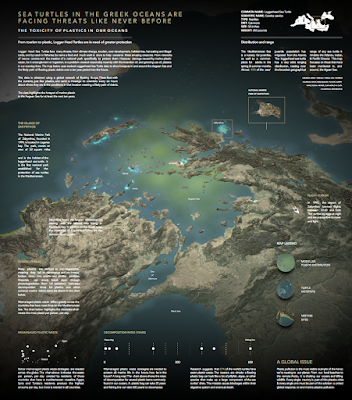 The map has a strong National Geographic feel to it-packed with dense information, some of it interactive. One of the things that is amazing is that it was created using Tableau, a data visualization software instead of using traditional cartographic software, although Mapbox was used for some of the cartographic display.
 Turtle hotspots are indicated "firefly" style in the bright blue. Below the National Marine Park of Zakynthos is highlighted. It is the first national park established for the protection of sea turtles in the Mediterranean. The airport on this island banned overnight flights because that is when the turtles lay their eggs and they are susceptible to the noise and light.
 One of the biggest threats to these turtles is plastic debris. They will ingest floating bags because they look like jellyfish to them. The graphics below the map area are interactive. You can hover over them for further information.
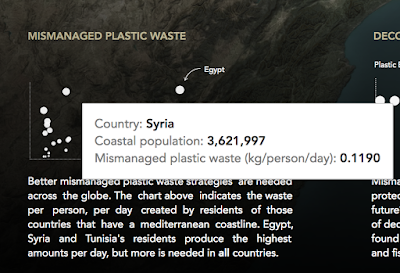 I also like the way he did the legend though some people think this kind of legend is hard to read. I've been criticized for using this kind of legend in a map but I think it's better to see the colors and symbols against the map background than stuffed into a white box.
 It looks like there are supposed to be some controls for interactively changing the angle and orientation of the map but i have not been able to get them to load on my computer. This is a problem overall that the visualization s very large and difficult to load. You can explore it here but be patient with the slow loading.


No comments:
Post a Comment