Thursday, January 21, 2021

The Wood Wide Web

Last night I was reading about the Wood Wide Web, an underground network created by fungi to transfer nutrients, minerals, water and even information among and between species. The diagram below is an illustration of this from Wikipedia.

I could not find a map showing the tree locations in that study but I did find this one from another study. The map shows a 30 cm square plot of Douglas firs. Any resemblance to Washington D.C. is purely coincidental.


This Douglas firs in green have arrows connecting their root systems to the sample locations represented by the black dots. The blue and pink shaded areas represent the fiber networks of two different species of fungus. The oldest trees have the most connections. The tree pointed out with an arrow is the oldest in the stand (94 years old at the time of this study) and has the most connections. 

This diagram shows the same stand with the firs colored by age, the youngest ones are yellow and the oldest dark green. The circles are sized by diameter and the thickness of the lines indicates the degree of connection. The forest is a connected network and removing older trees can have a huge impact on its resilience. More information on this study is here and for an interesting look at these networks see this article in Science Focus.

Wednesday, January 13, 2021

Natural Disasters of 2020

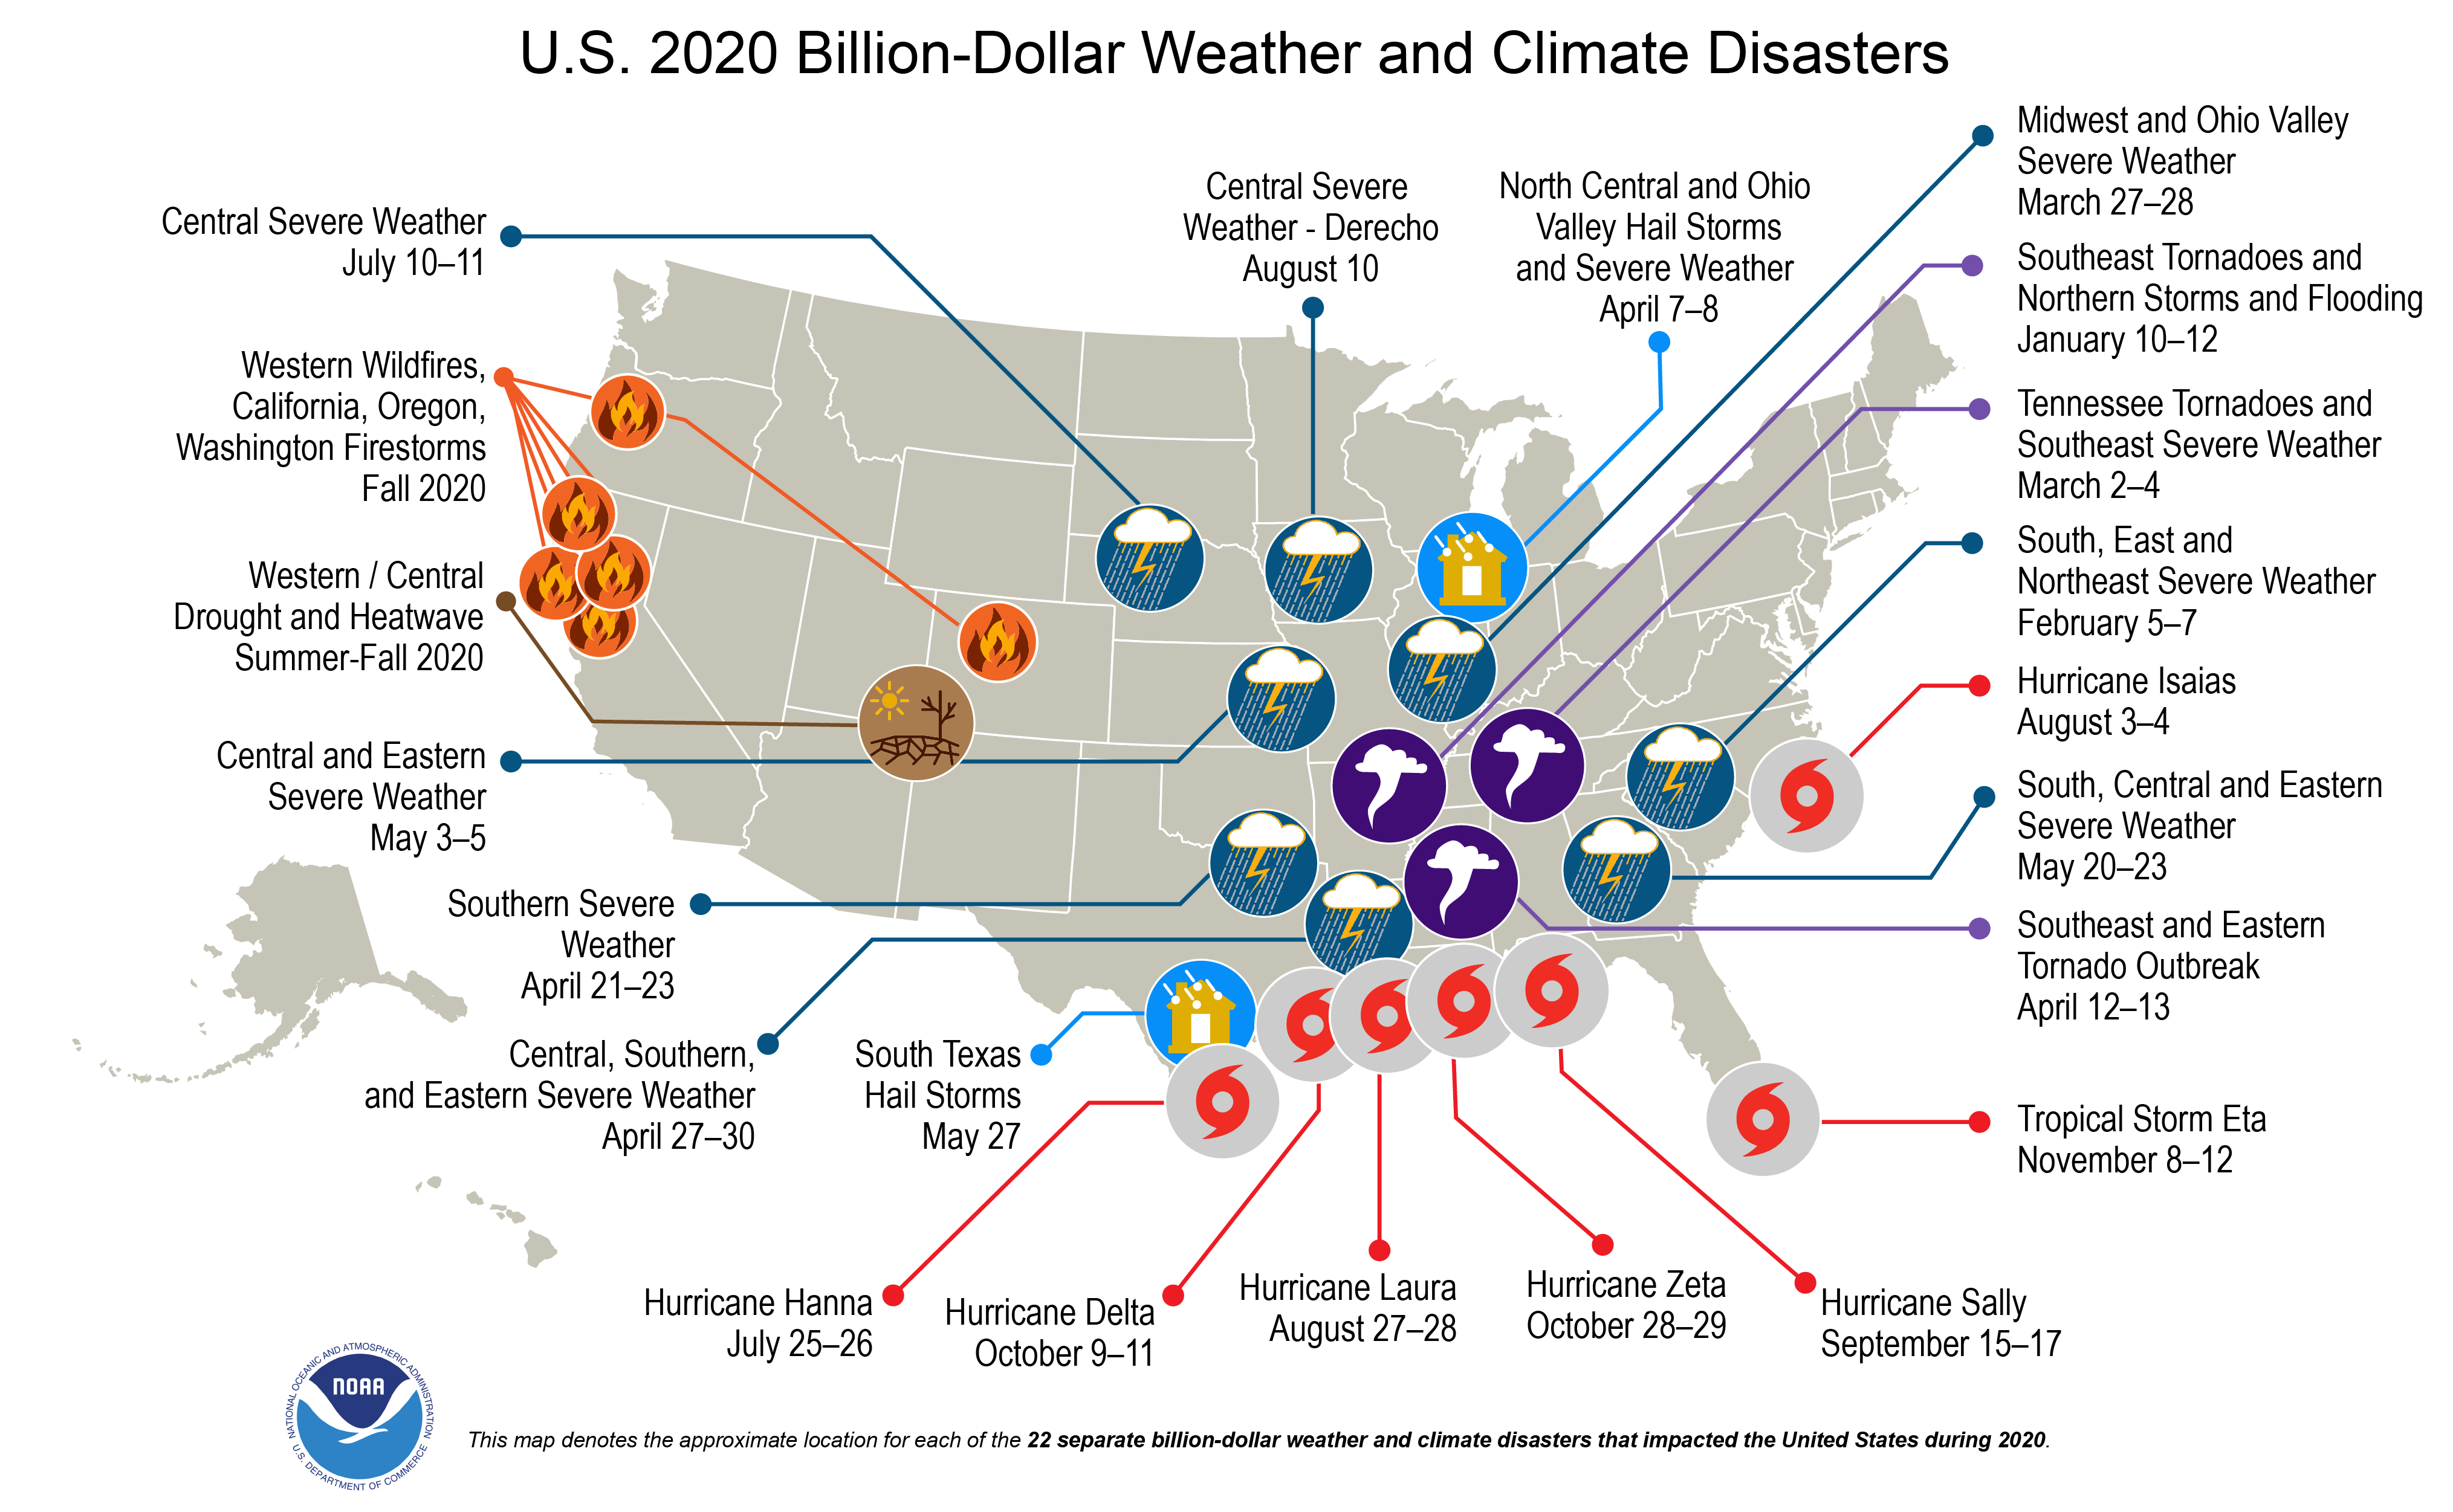
In addition to all the other problems of 2020, it was also a record setting year for natural disasters in the United States and worldwide. In the U.S. there were 22 weather and climate disasters with losses exceeding $1 billion. The previous record for this scale of loss was 16 in 2011 and 2017. These disasters also caused 262 deaths. Here's a map from NOAA.

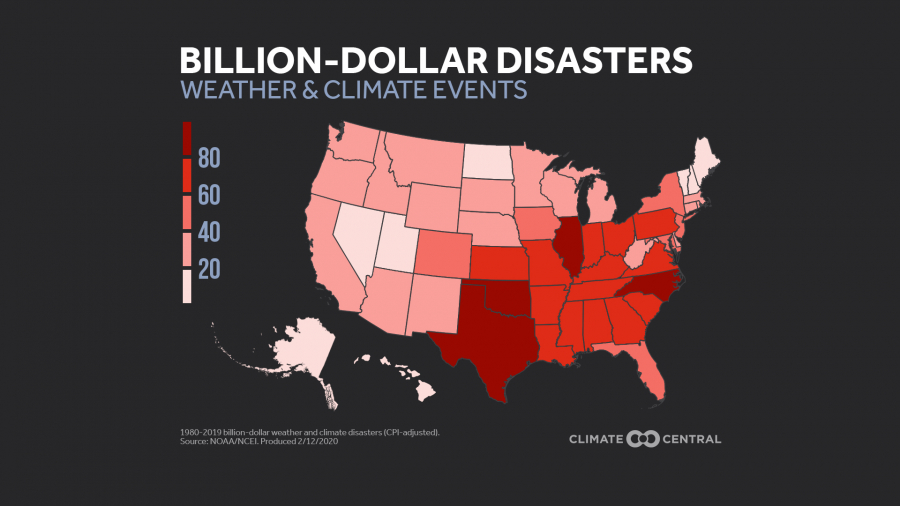
Climate Central has maps showing number of disasters by state (this is all billion dollar events since 1980),

and more interestingly by type, though they should have picked a more clearly distinct color for TROPICS.

Finally, here's a map from Reddit showing disaster type by county. 


Like most things on Reddit there are many caveats. Unlike most things on Reddit the author was good enough to include them here.


Wednesday, January 6, 2021

Harbin Ice and Snow Festival

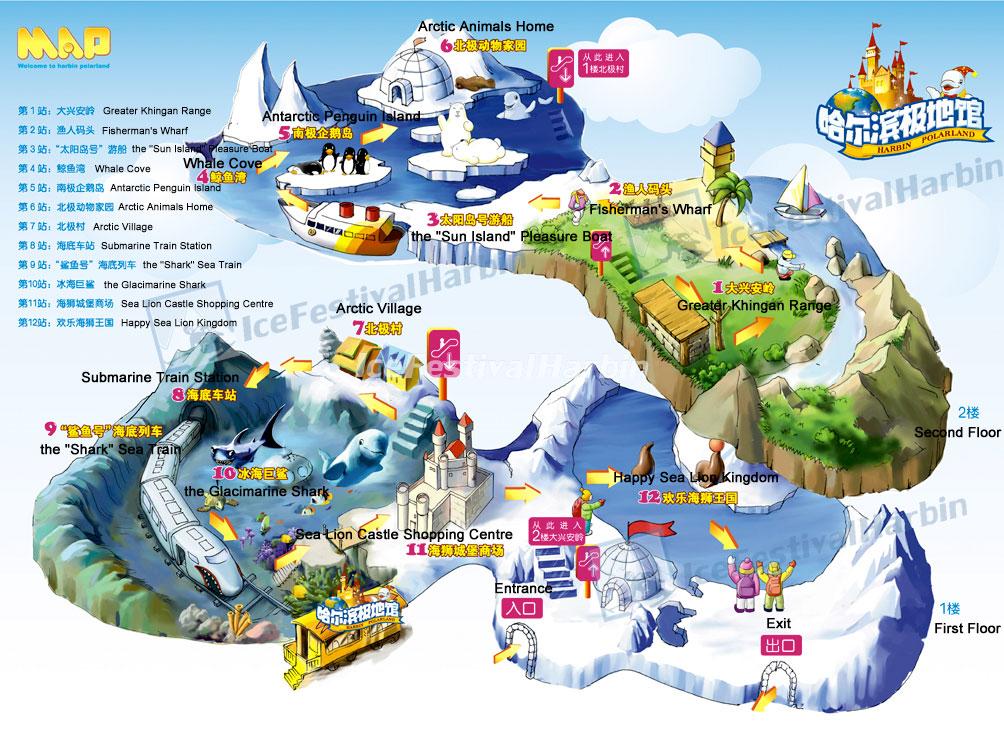
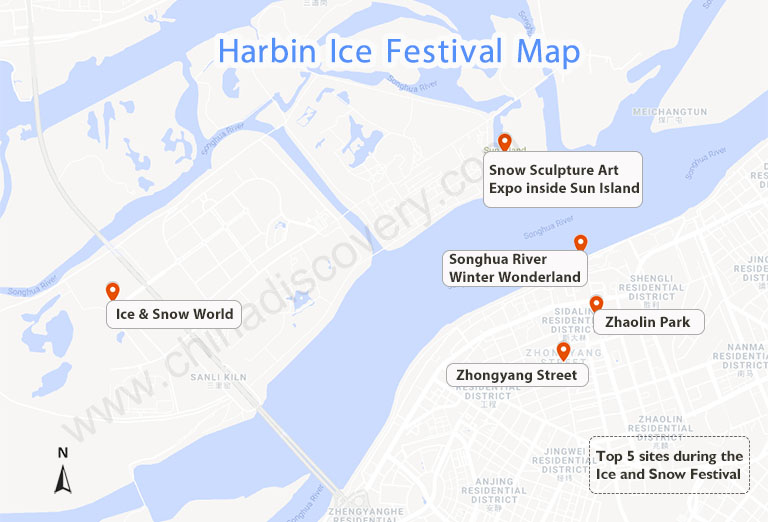
 Need a break from the dreary weather and political theater of January? Here are some whimsical maps of the Harbin Ice & Snow Festival and the nearby China Snow Town.

The festival features several theme parks, skating rinks, ice sculptures and some really nice light displays
 

This map is more useful but less fun.


The Snow Town is a ski resort with places named "Snow Charm Hotel" and "Dream Home"

You can't travel there this year but you can see more here. One final sunset picture.


Wednesday, December 30, 2020

The Coronavirus Worldwide

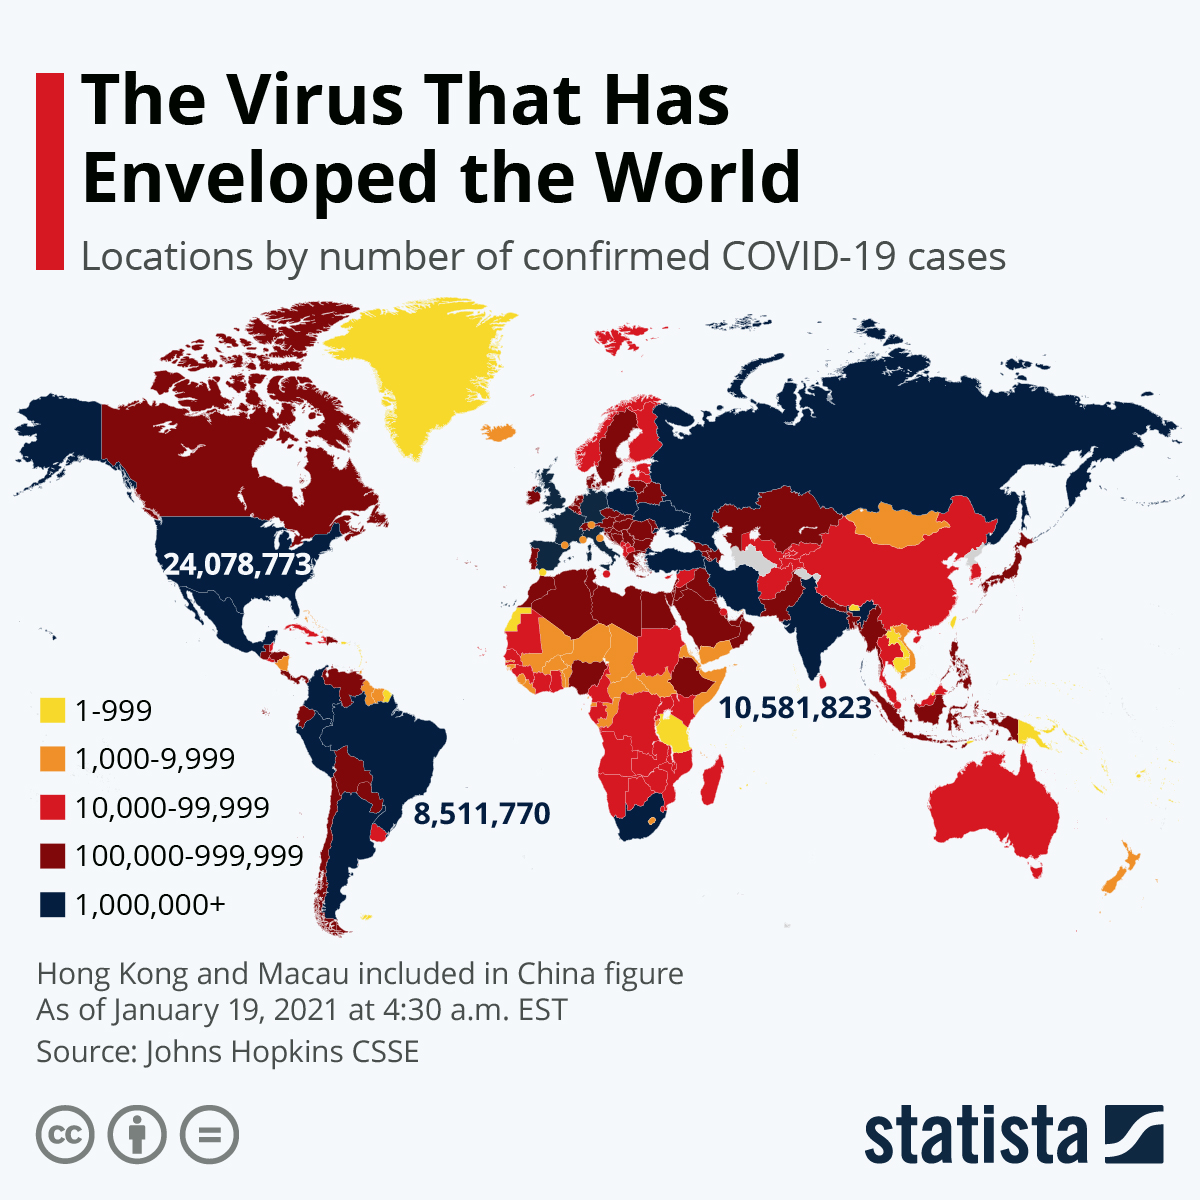
The most appropriate way I can think of to end 2020, this year of pandemic, is to show where we are at worldwide.

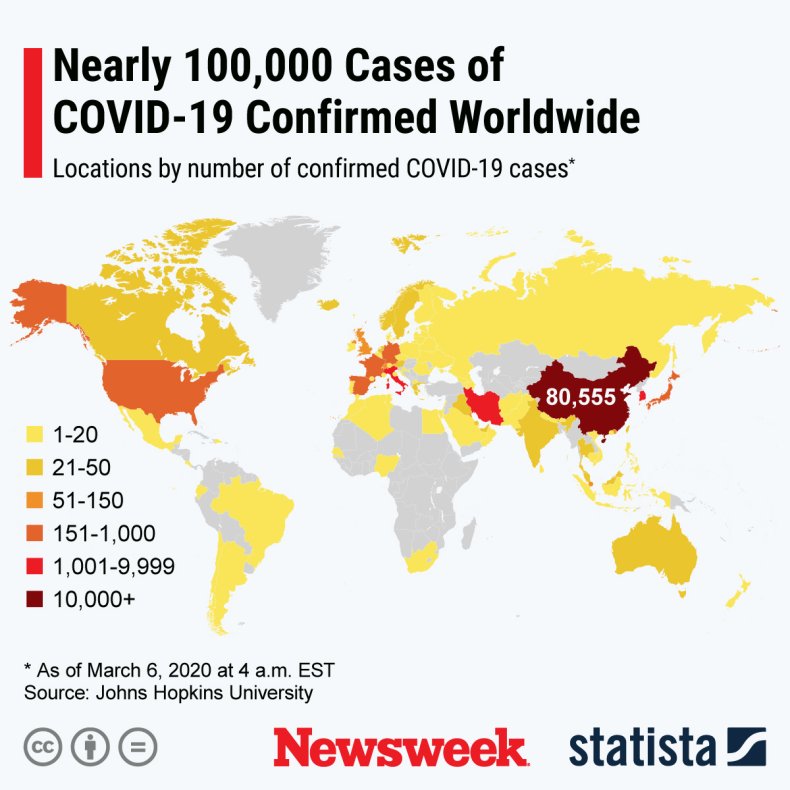
This is from statista. Here is the same map from March 6, 2020 via Newsweek. Note that the highest number category in March is now the middle category.

 Stay safe, listen to science instead of grandstanding politicians, and maybe we'll have better news in 2021.


Wednesday, December 23, 2020

The Springfield Subway

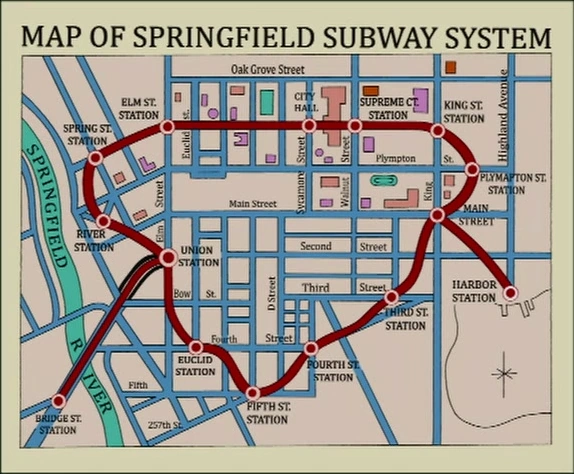
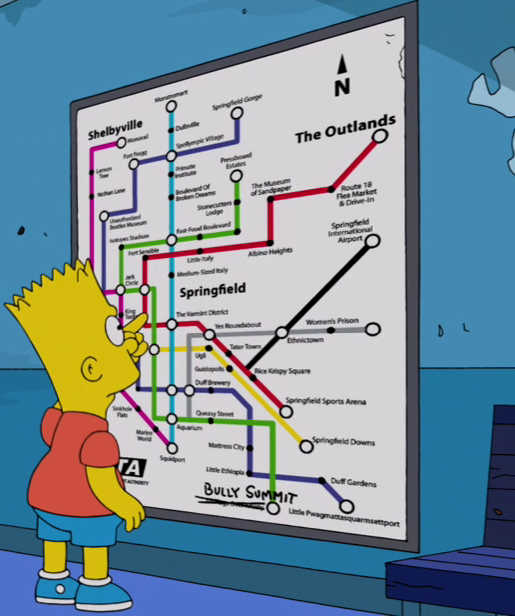
I recently saw the Simpsons episode Postcards from the Wedge for the first time. It prominently features this map of the abandoned Springfield Subway.

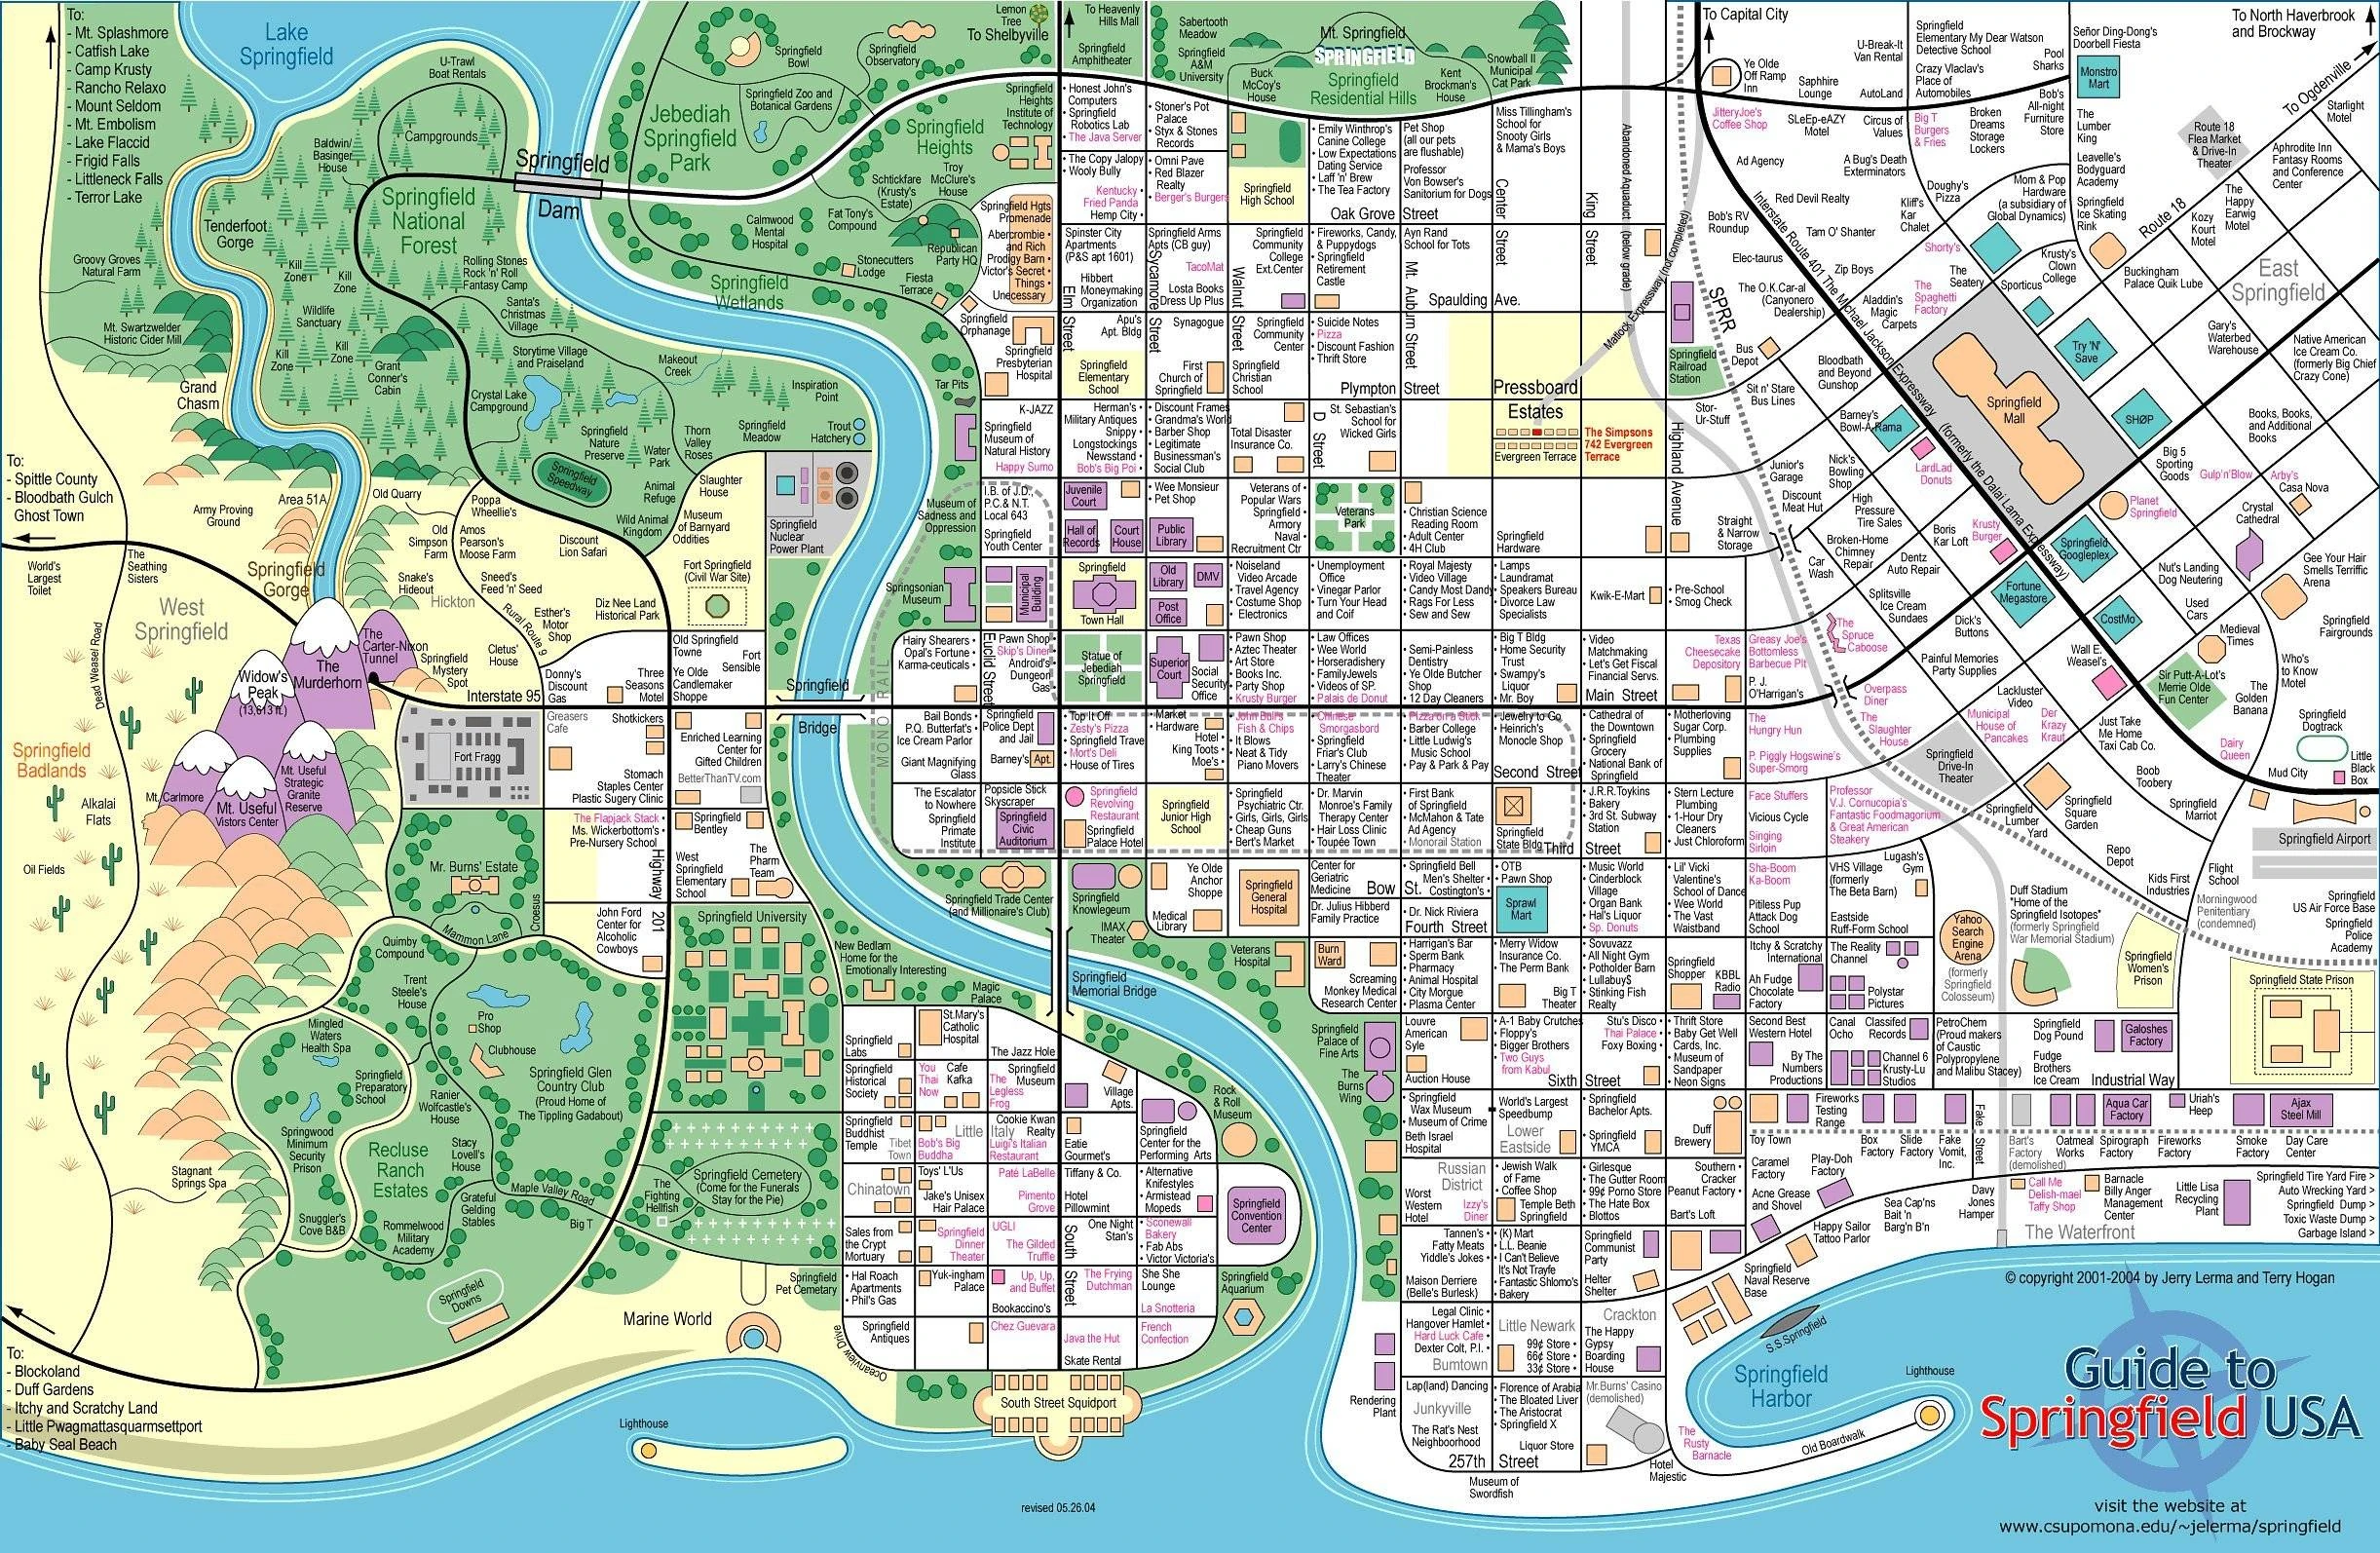
In a long ago post I featured the map of Springfield - a direct link to it is here. 

While these maps look very different a close look shows an unexpected attention to geographic detail. The street layouts are very similar between the two. The street names are also consistent. 

A newer version of the subway appears in a later episode with more jokes but less geographic fidelity. This version is full of puns such as the musical references Boulevard of Broken Dreams and Yes Roundabout. There's also Queasy Street and a Varmint District.

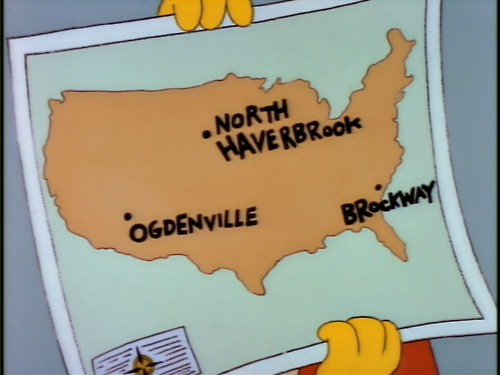
Springfield also famously had a monorail. I have not found any maps of it but here are the other towns that were sold on a monorail. This map is also available as a T-shirt.


Wednesday, December 16, 2020

Naismith International Park

Kirk Goldsberry a former geography professor and basketball data visualization specialist has just unleashed a new map, "Naismith International Park". Named after the inventor of basketball, it is a fantasy landscape shaped like the frontcourt of a basketball court.

Cleverly designed with the fonts, symbols and colors of the U.S. National Park Service the map is full of basketball references, some of which I even understand. The elevations are also a nice touch.

I don't follow basketball very closely but I would guess that the placement of player names relates to their shot maps (covered here in a previous post).

As a 76ers fan my favorite spot is the Round Mound of Rebound.

You can purchase a copy of the map (or just admire it some more) here.


Wednesday, December 9, 2020

Mapping NYC Capital Spending

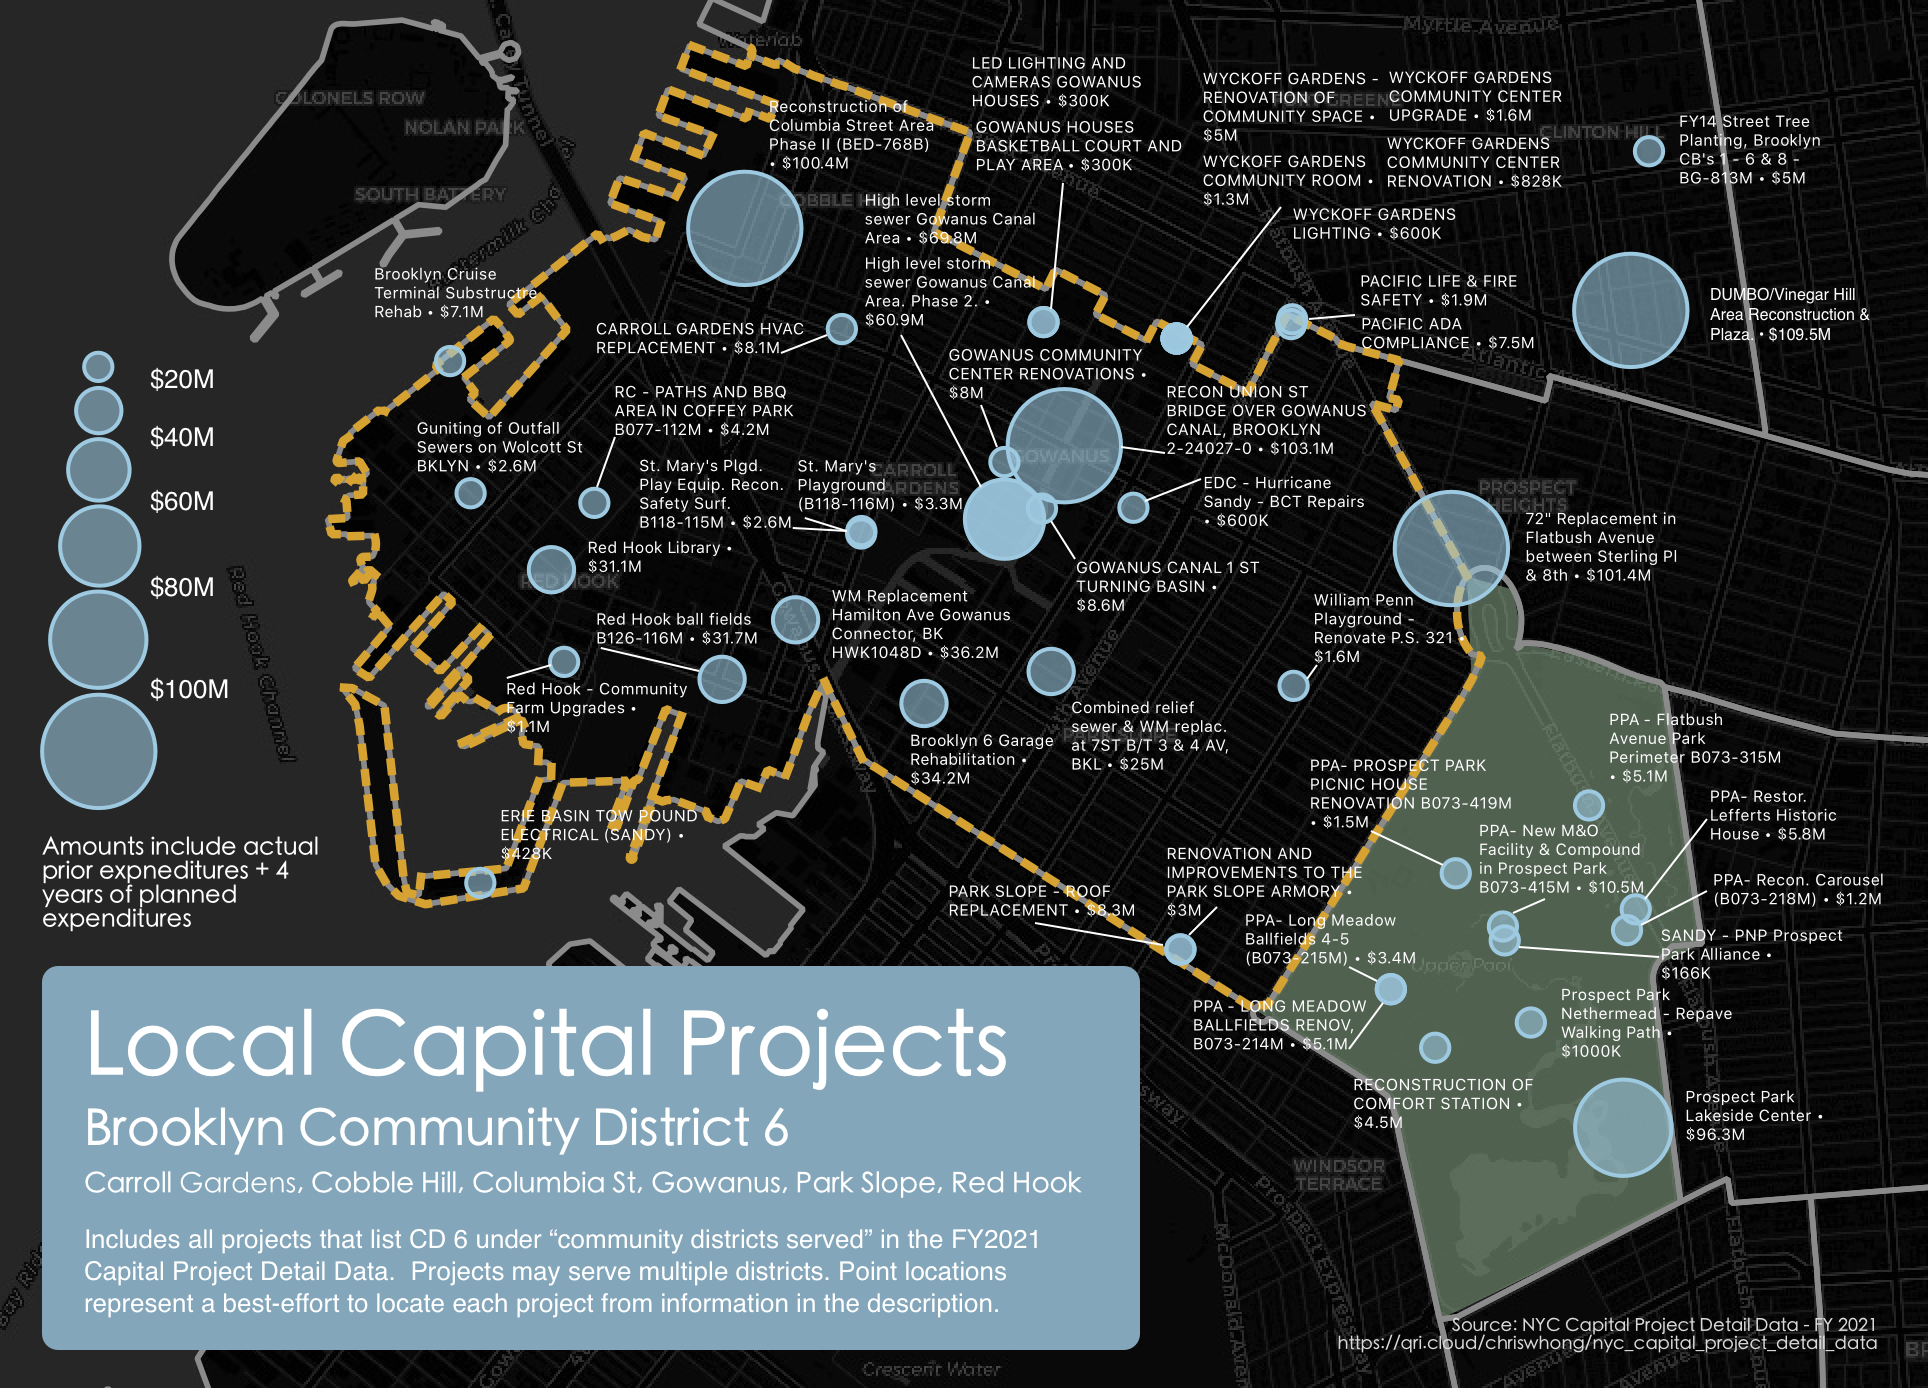
Chris Whong, a former planner for the City of New York found a way to muddle through various budget documents to quantify and map where money is being spent on capital projects. The process, documented in a Medium article, involved "scraping" PDF documents ("where data goes to die") and then grouping projects by district to look at his own neighborhood in Brooklyn. Here is the result - click for a more readable version

A sample area.


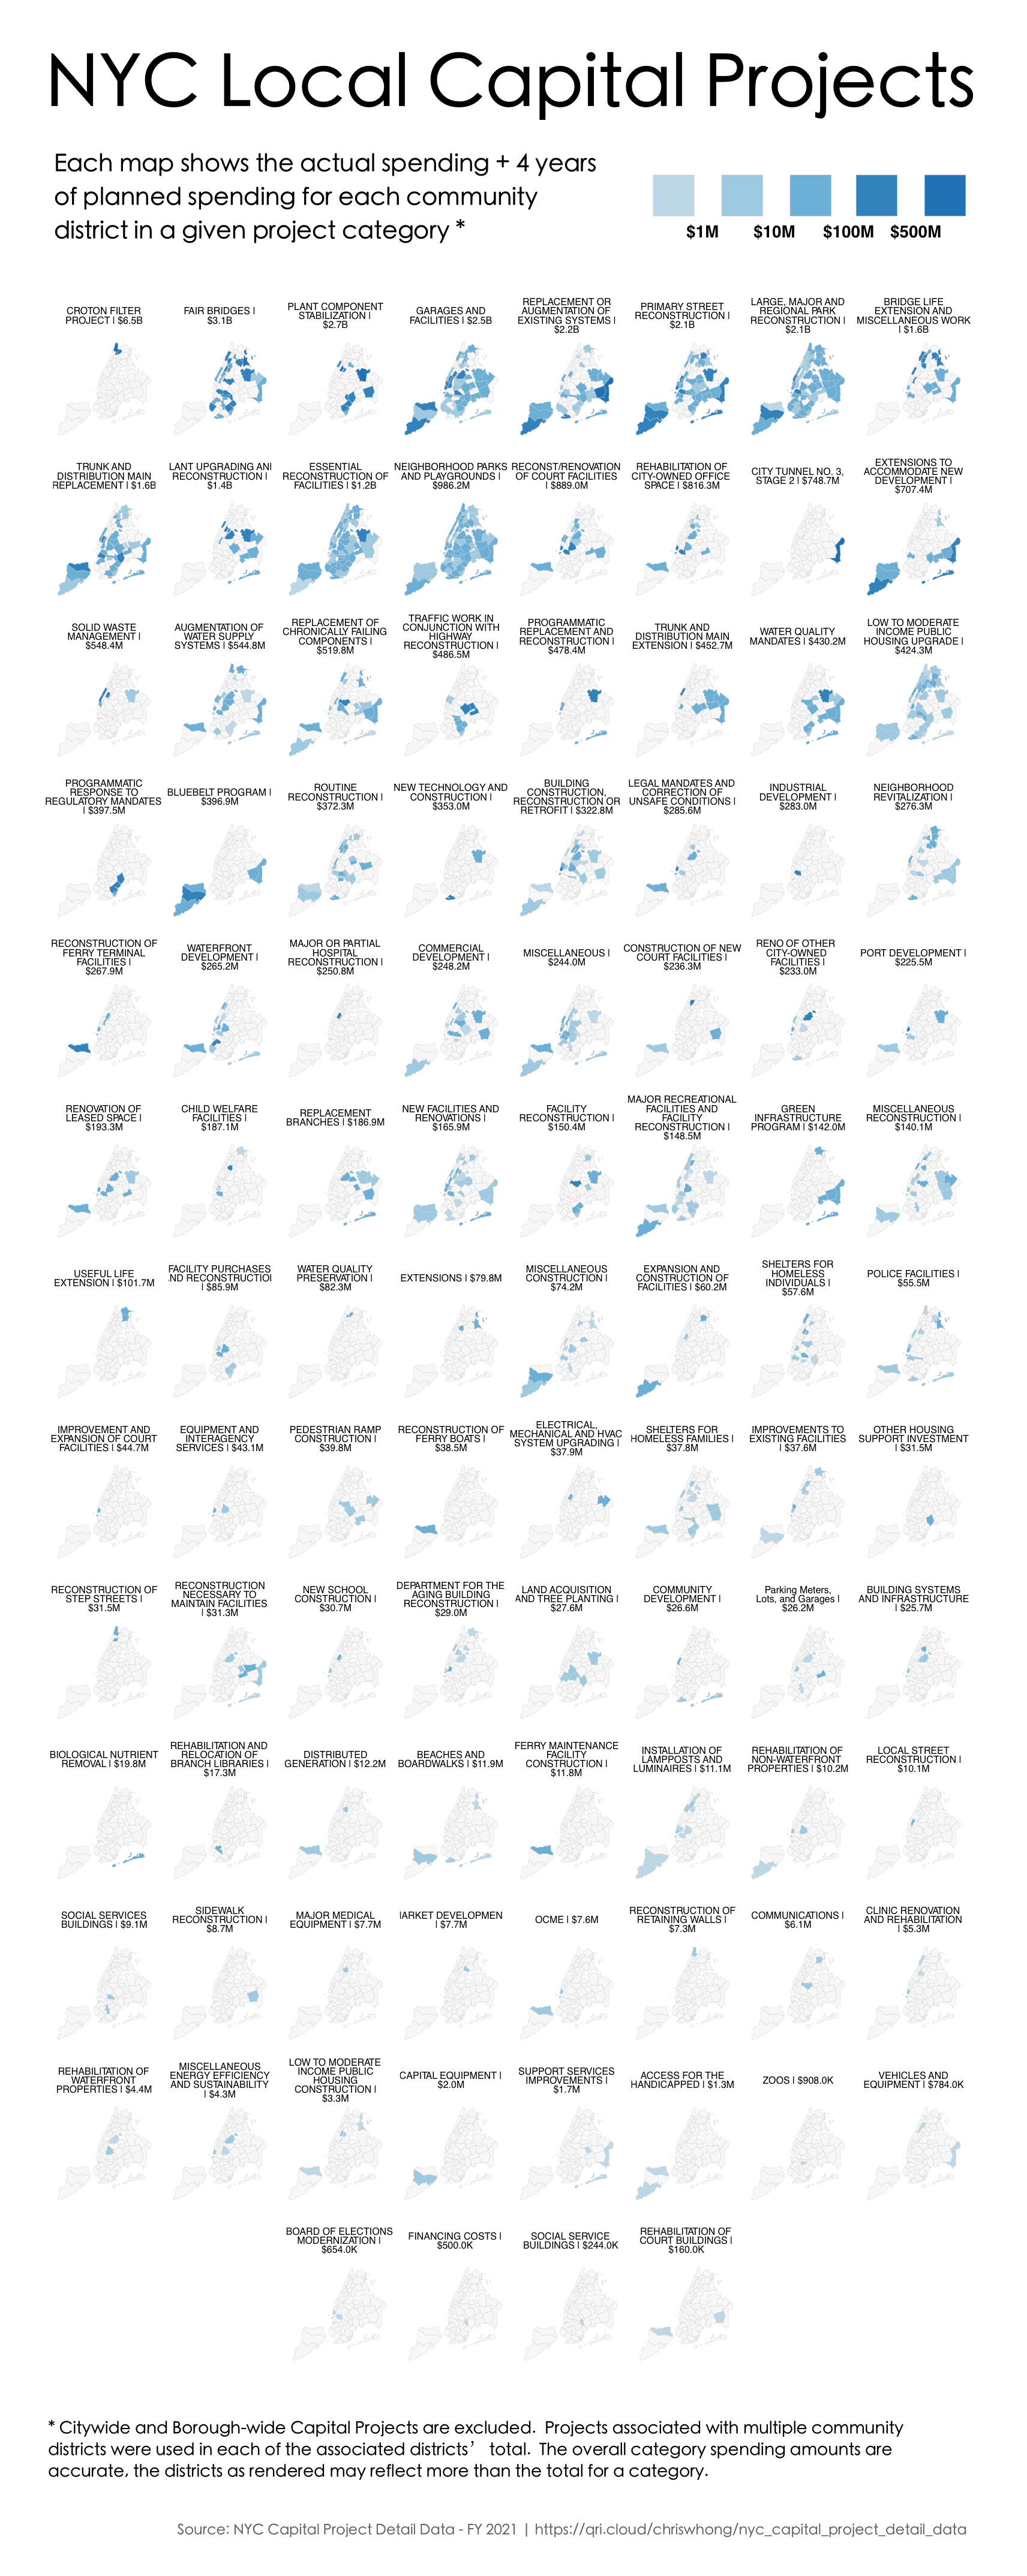
He also did some nice "small multiple" maps showing 4 year spending by project type across the city. The image below is just a sample - the thing is huge. Clicking it will get you the whole thing.


For details on the convoluted process click here.