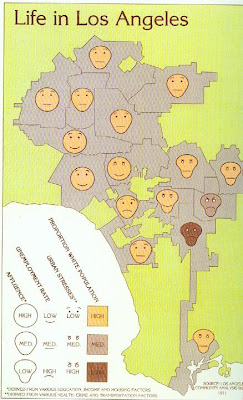
This is a ridiculously clever map showing an index of happiness in LA using 4 separate variables, each showing a facial trait representing differing levels of stress or racial makeup. These are Chernoff Faces, a visualization technique created by mathematician Herman Chernoff. The map was created in 1971 by Cal State geography professor Eugene Turner for the Los Angeles Community Analysis Bureau.