Thursday, May 12, 2022

The Disapperance of Native American Land

Native American losses began at first contact with European settlers. "European colonization of the Americas, which began in 1492, resulted in a precipitous decline in Native American population because of new diseases, wars, ethnic cleansing, and enslavement." - via Wikipedia

Native Americans had mostly been driven out of the original thirteen colonies by the end of the American Revolution. The map below shows further land cessations between 1789 and 1816 in the "northwest" region.

via Getty Images
They were pushed even further westward into "strips of land stacked like cordwood" (quoted from Prairie Fires: The American Dreams of Laura Ingalls Wilder by Caroline Fraser p. 49). The designated Indian Territory (lands south of the Osages on the map below) was assigned to the "Five Civilized Tribes".

These tribes, the Cherokee, Chickasaw, Choctaw, Creek and Seminole were considered civilized because they had adopted Anglo-American practices such as Christianity, capitalism and in some cases the "civilized" practice of slavery. Despite being "civilized" they were still forced off their lands in the southeast and relocated westwards in the Trail of Tears.

The strip in southern Kansas was the Osage Diminished Reserve, an area left to them after signing many bad faith treaties. The rivers of their former land still bear the tribe's name.

Even after being removed from the rest of their land and granted this area of Kansas, it too became overrun with white squatters. These people included Charles Ingalls, father of Laura Ingalls Wilder. They settled on land they did not own and eventually drove the Osage out of Kansas entirely, forcing them to also relocate to Indian Territory. The tribe's base is now in northeastern Oklahoma.

Here is the full map above showing the lands assigned to "emigrant Indians" west of Arkansas and Missouri.

The Chickasaw after a long dispute paid the Choctaw for the westernmost part of their land. 

This map via Wikipedia illustrates the Trail of Tears beginning in the 1830's.

Some Cherokee had settled in northeastern Texas where they signed a treaty with Texas Republic President Sam Houston. In 1839 his successor backtracked on this treaty and sent militia to forcibly relocate them to Indian Territory. Here is a map of their final battle in Van Zandt County, via the Oklahoma Historical Society.

After the Civil War further incursions were made on Indian Territory with lands in the center of the future state ceded for potential white settlement. The western half of Indian Territory became Oklahoma Territory in 1890. Reservations in western Oklahoma were opened to white settlement leading to a series of land runs and drastically shrinking Indian Territory. Here is a map of Oklahoma and Indian Territories that year via Wikipedia. The thick red line divides the two.

Both territories sought statehood but in response to concerns from eastern politicians about creating two new western states they were combined into one state, Oklahoma, in 1907. Congress sought to dissolve the reservations as part of Oklahoma's statehood but the laws were vague and unevenly applied and has led to decades of uncertainty. In 2020 The Supreme Court of the United States, in the case of McGirt v. Oklahoma determined that much of the eastern part of the state remains Native American land. Though this case was primarily about jurisdiction of criminal cases, it has opened up questions about ownership, taxation, zoning and the enforcement of environmental policies.

A 1914 map submitted as part of the McGirt case shows the entire area that was post-1890 Indian Territory as Indian Reservations,

Image from Supreme Court Docket 18-9526 - Appendix p.33

making this by far the largest tract of Native American land in the country.

The future of this land will be determined through extensive negotiations between the tribes and state and federal authorities. For a deep dive into the Supreme Court's ruling see Indianz.com

Wednesday, May 4, 2022

My Family's Exodus from Ukraine

A few weeks ago some of my family members had a Passover seder. Passover is an exodus story. With huge numbers trying to leave Ukraine right now our thoughts turned to my own family's exodus from there. Rising antisemitism, employment restrictions and forced military service drove my family to risk everything to escape from Khotyn, Ukraine (then part of Austria-Hungary) and come to the United States. My great grandfather was the first to leave, in 1905. He traveled by steamship from Hamburg, Germany to Philadelphia. How he got to Hamburg is less clear but the shipping companies arranged for passengers to travel there by train with minimal harassment. I made a map of the trip based on railroad maps of that era, making assumptions about the most likely route across Europe.

There was no railroad in Khotyn at the time so they would have needed to travel the 30 kilometers to Czernowicz (not Cherivsti), probably in secret. My great grandmother followed with several children two years later. It must have been very frightening to leave everything behind to go to a place where they didn't know the language or how safe they would be. I'm sure today's Ukrainians are going through similar or worse horrors. Here is a second, less interesting map I made to complete the journey.

There is a story about my great grandmother going grocery shopping on her first day and not recognizing the house on the way back because the houses in South Philadelphia all looked the same. She had to walk up and down the street a few times before a neighbor came and helped her. If you see a lost refugee, They might need your help!


Wednesday, April 27, 2022

The Quarantine Atlas

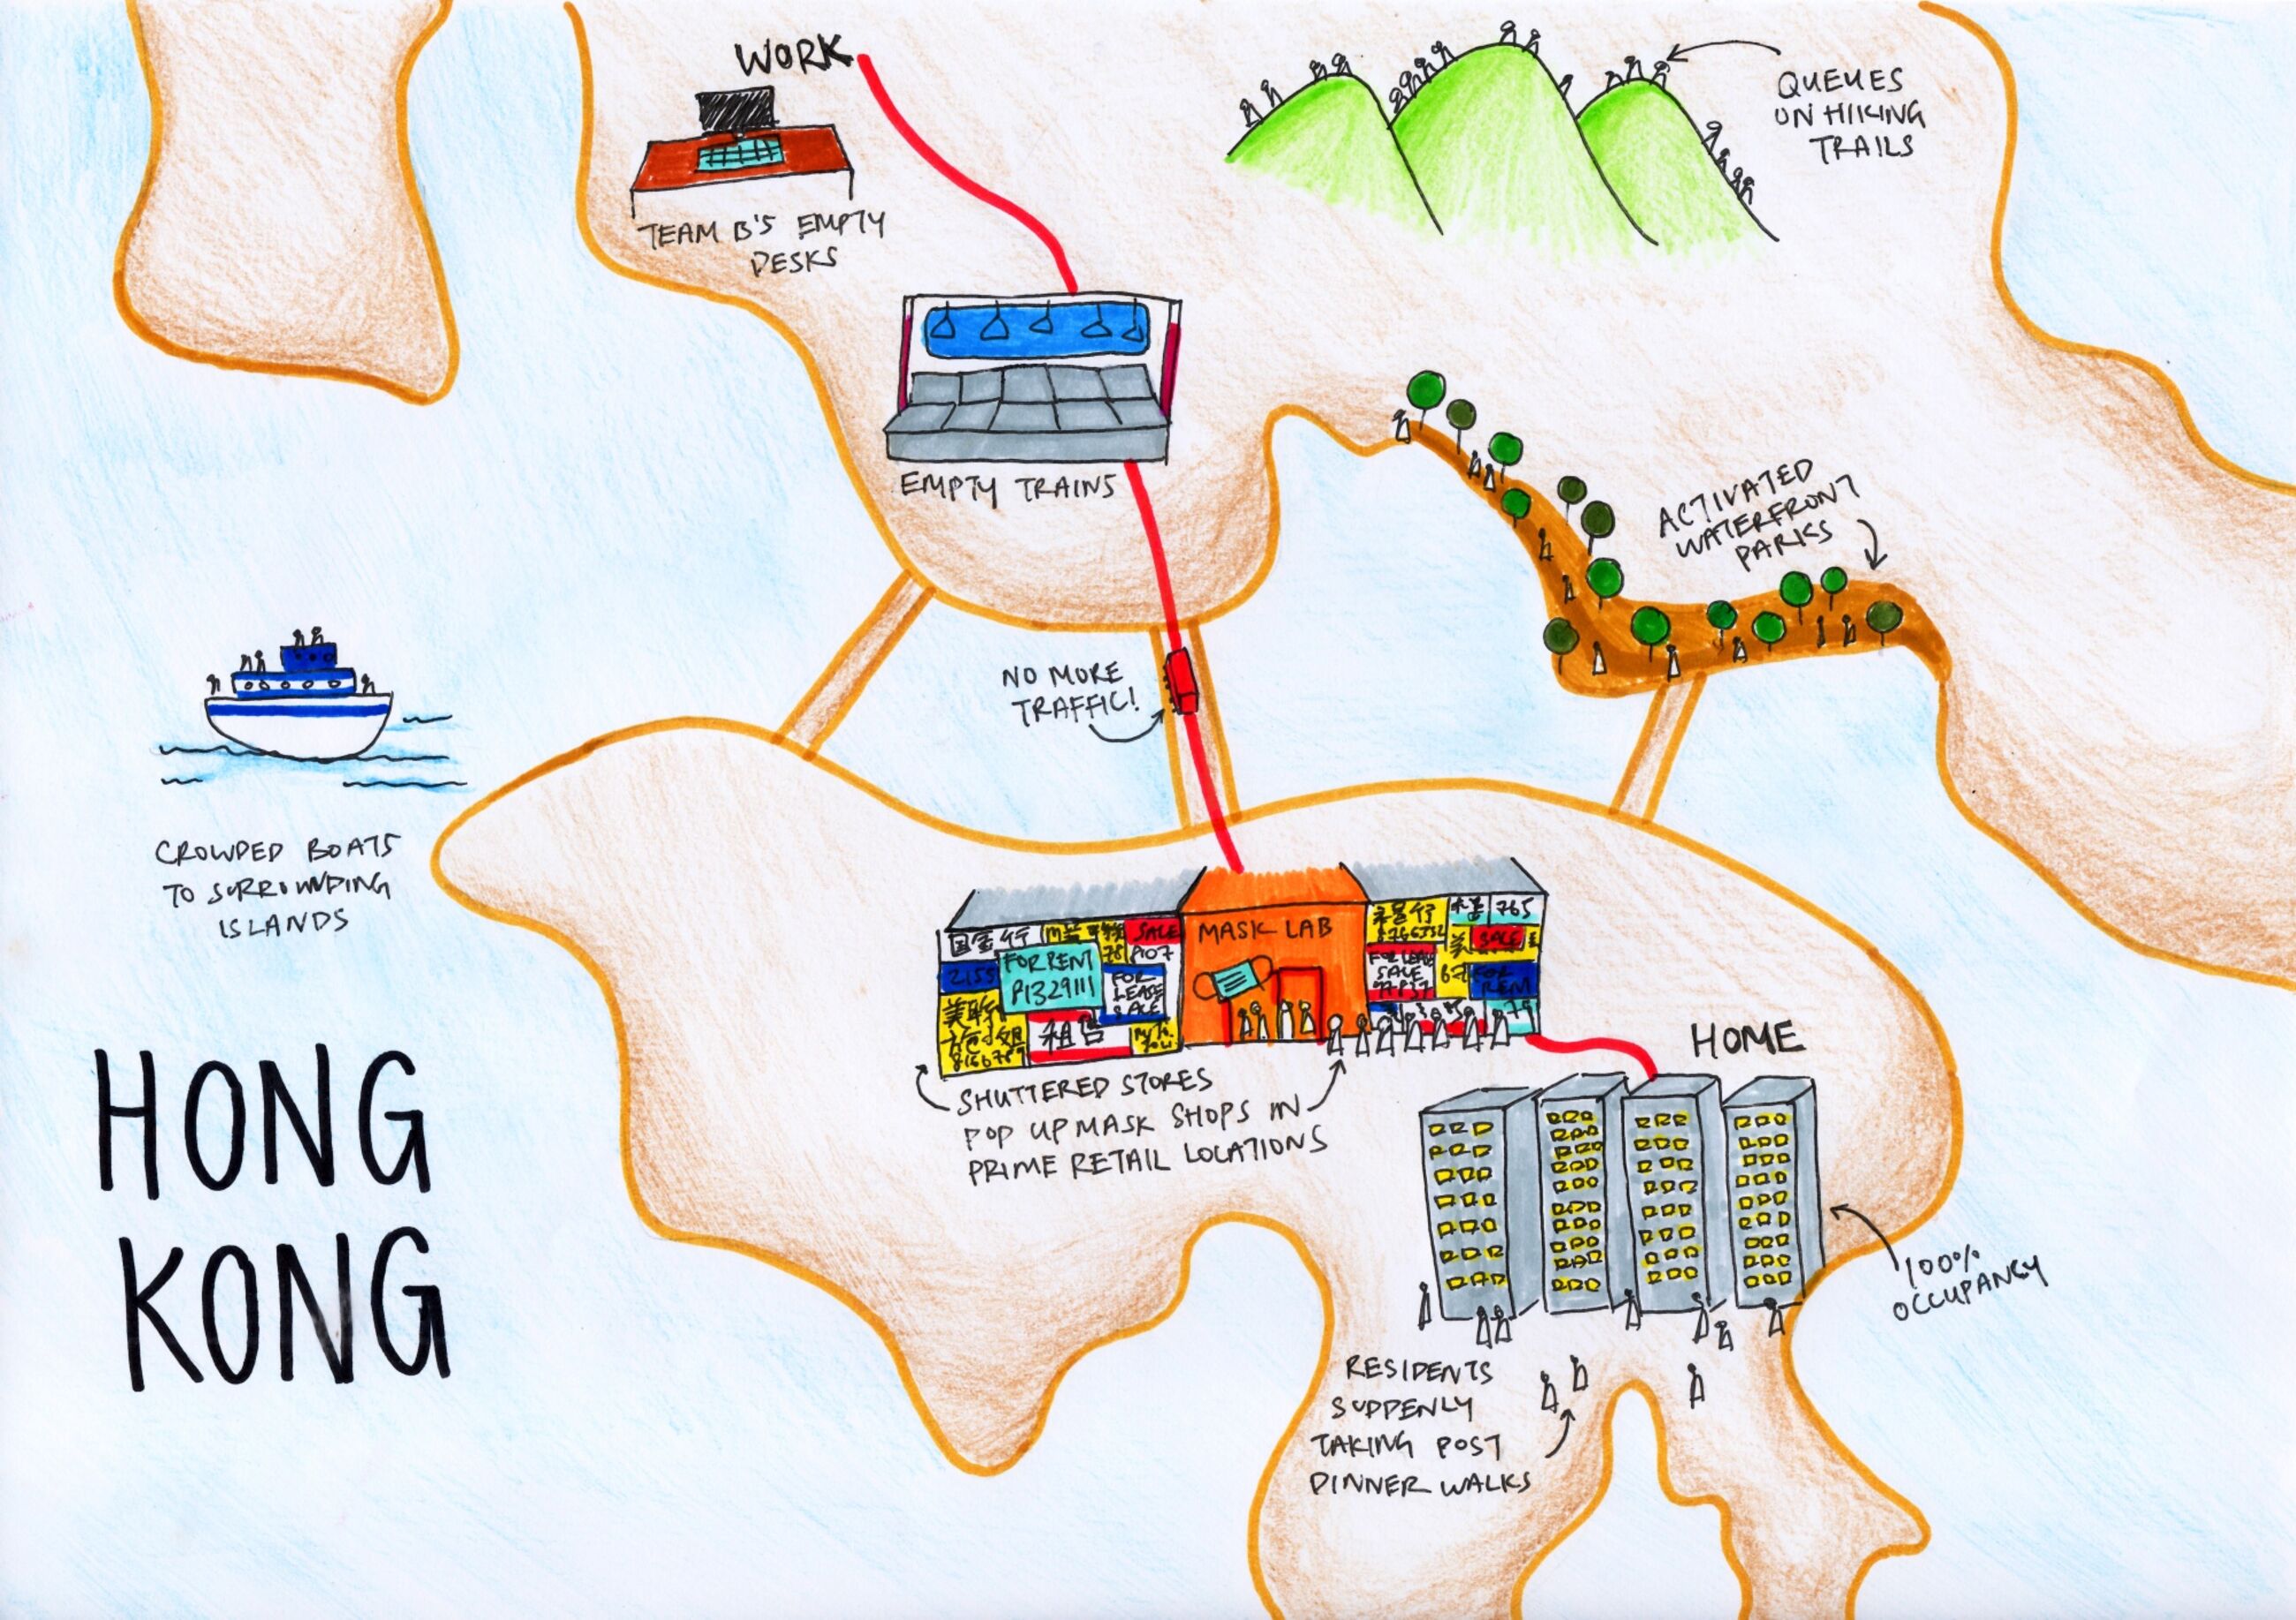
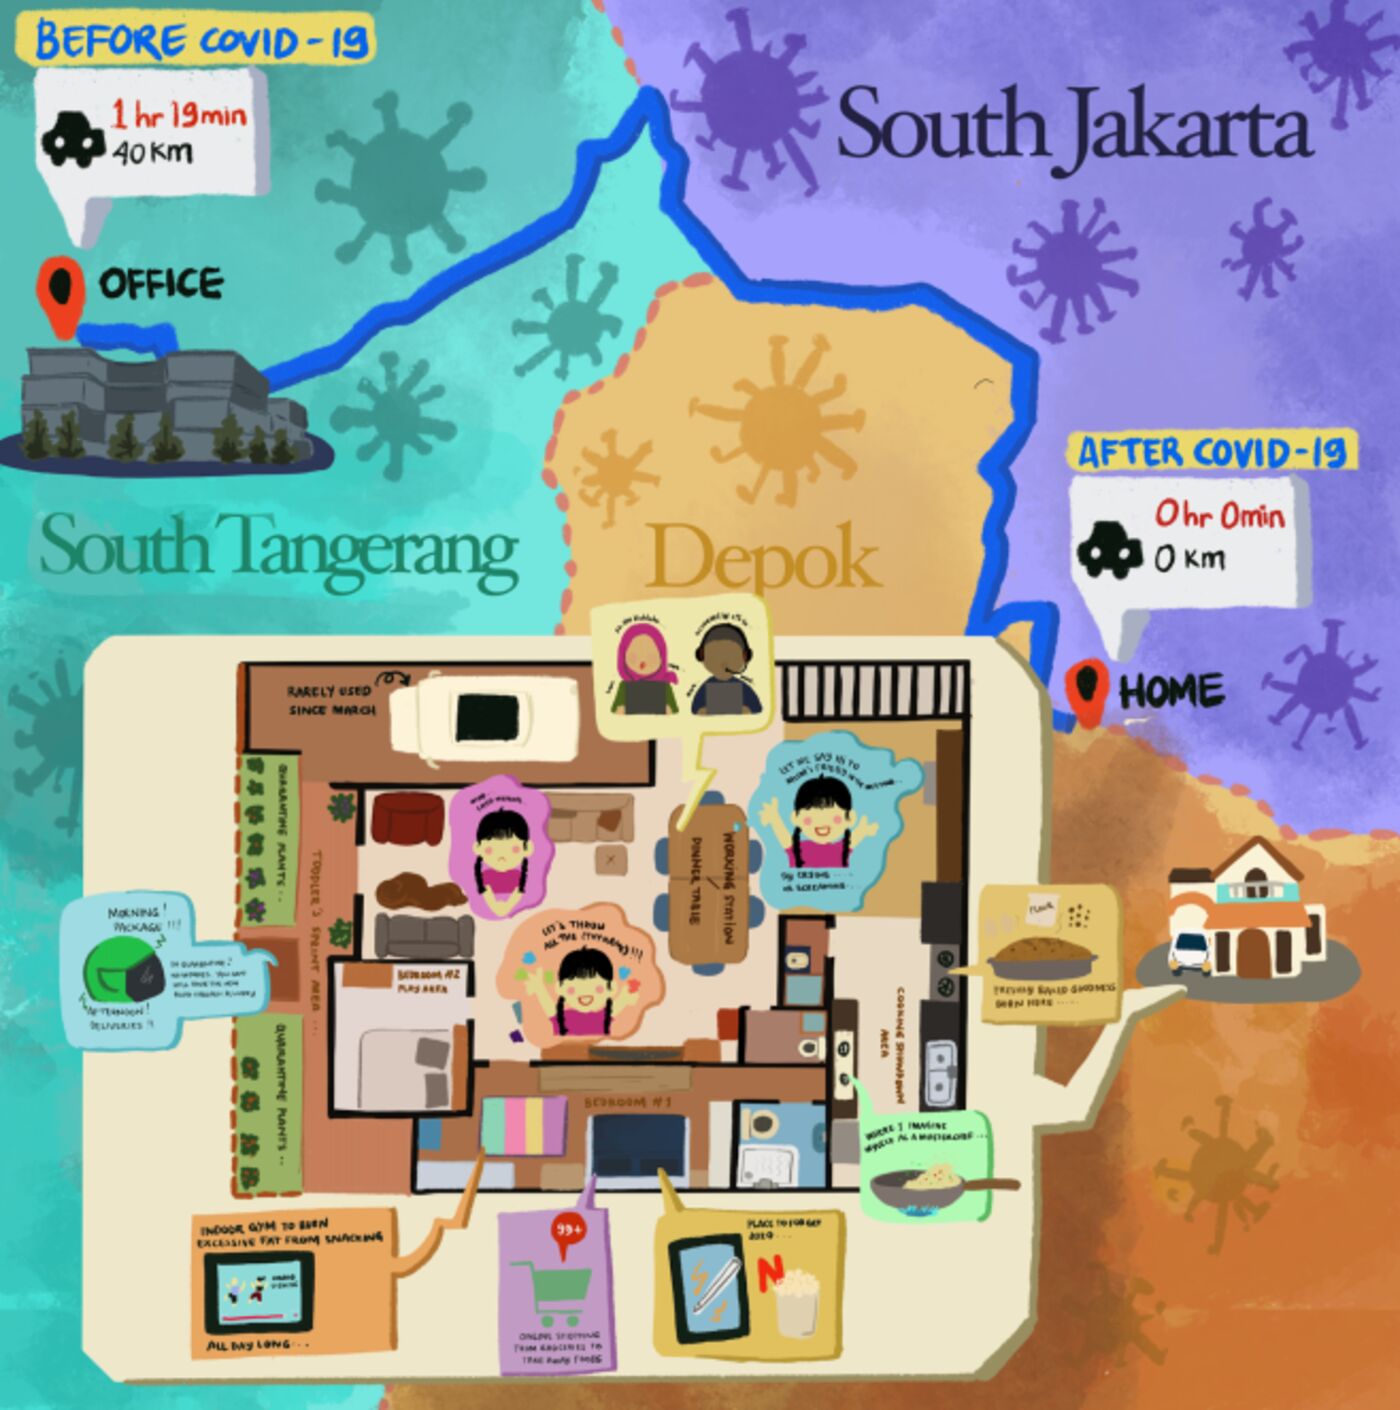
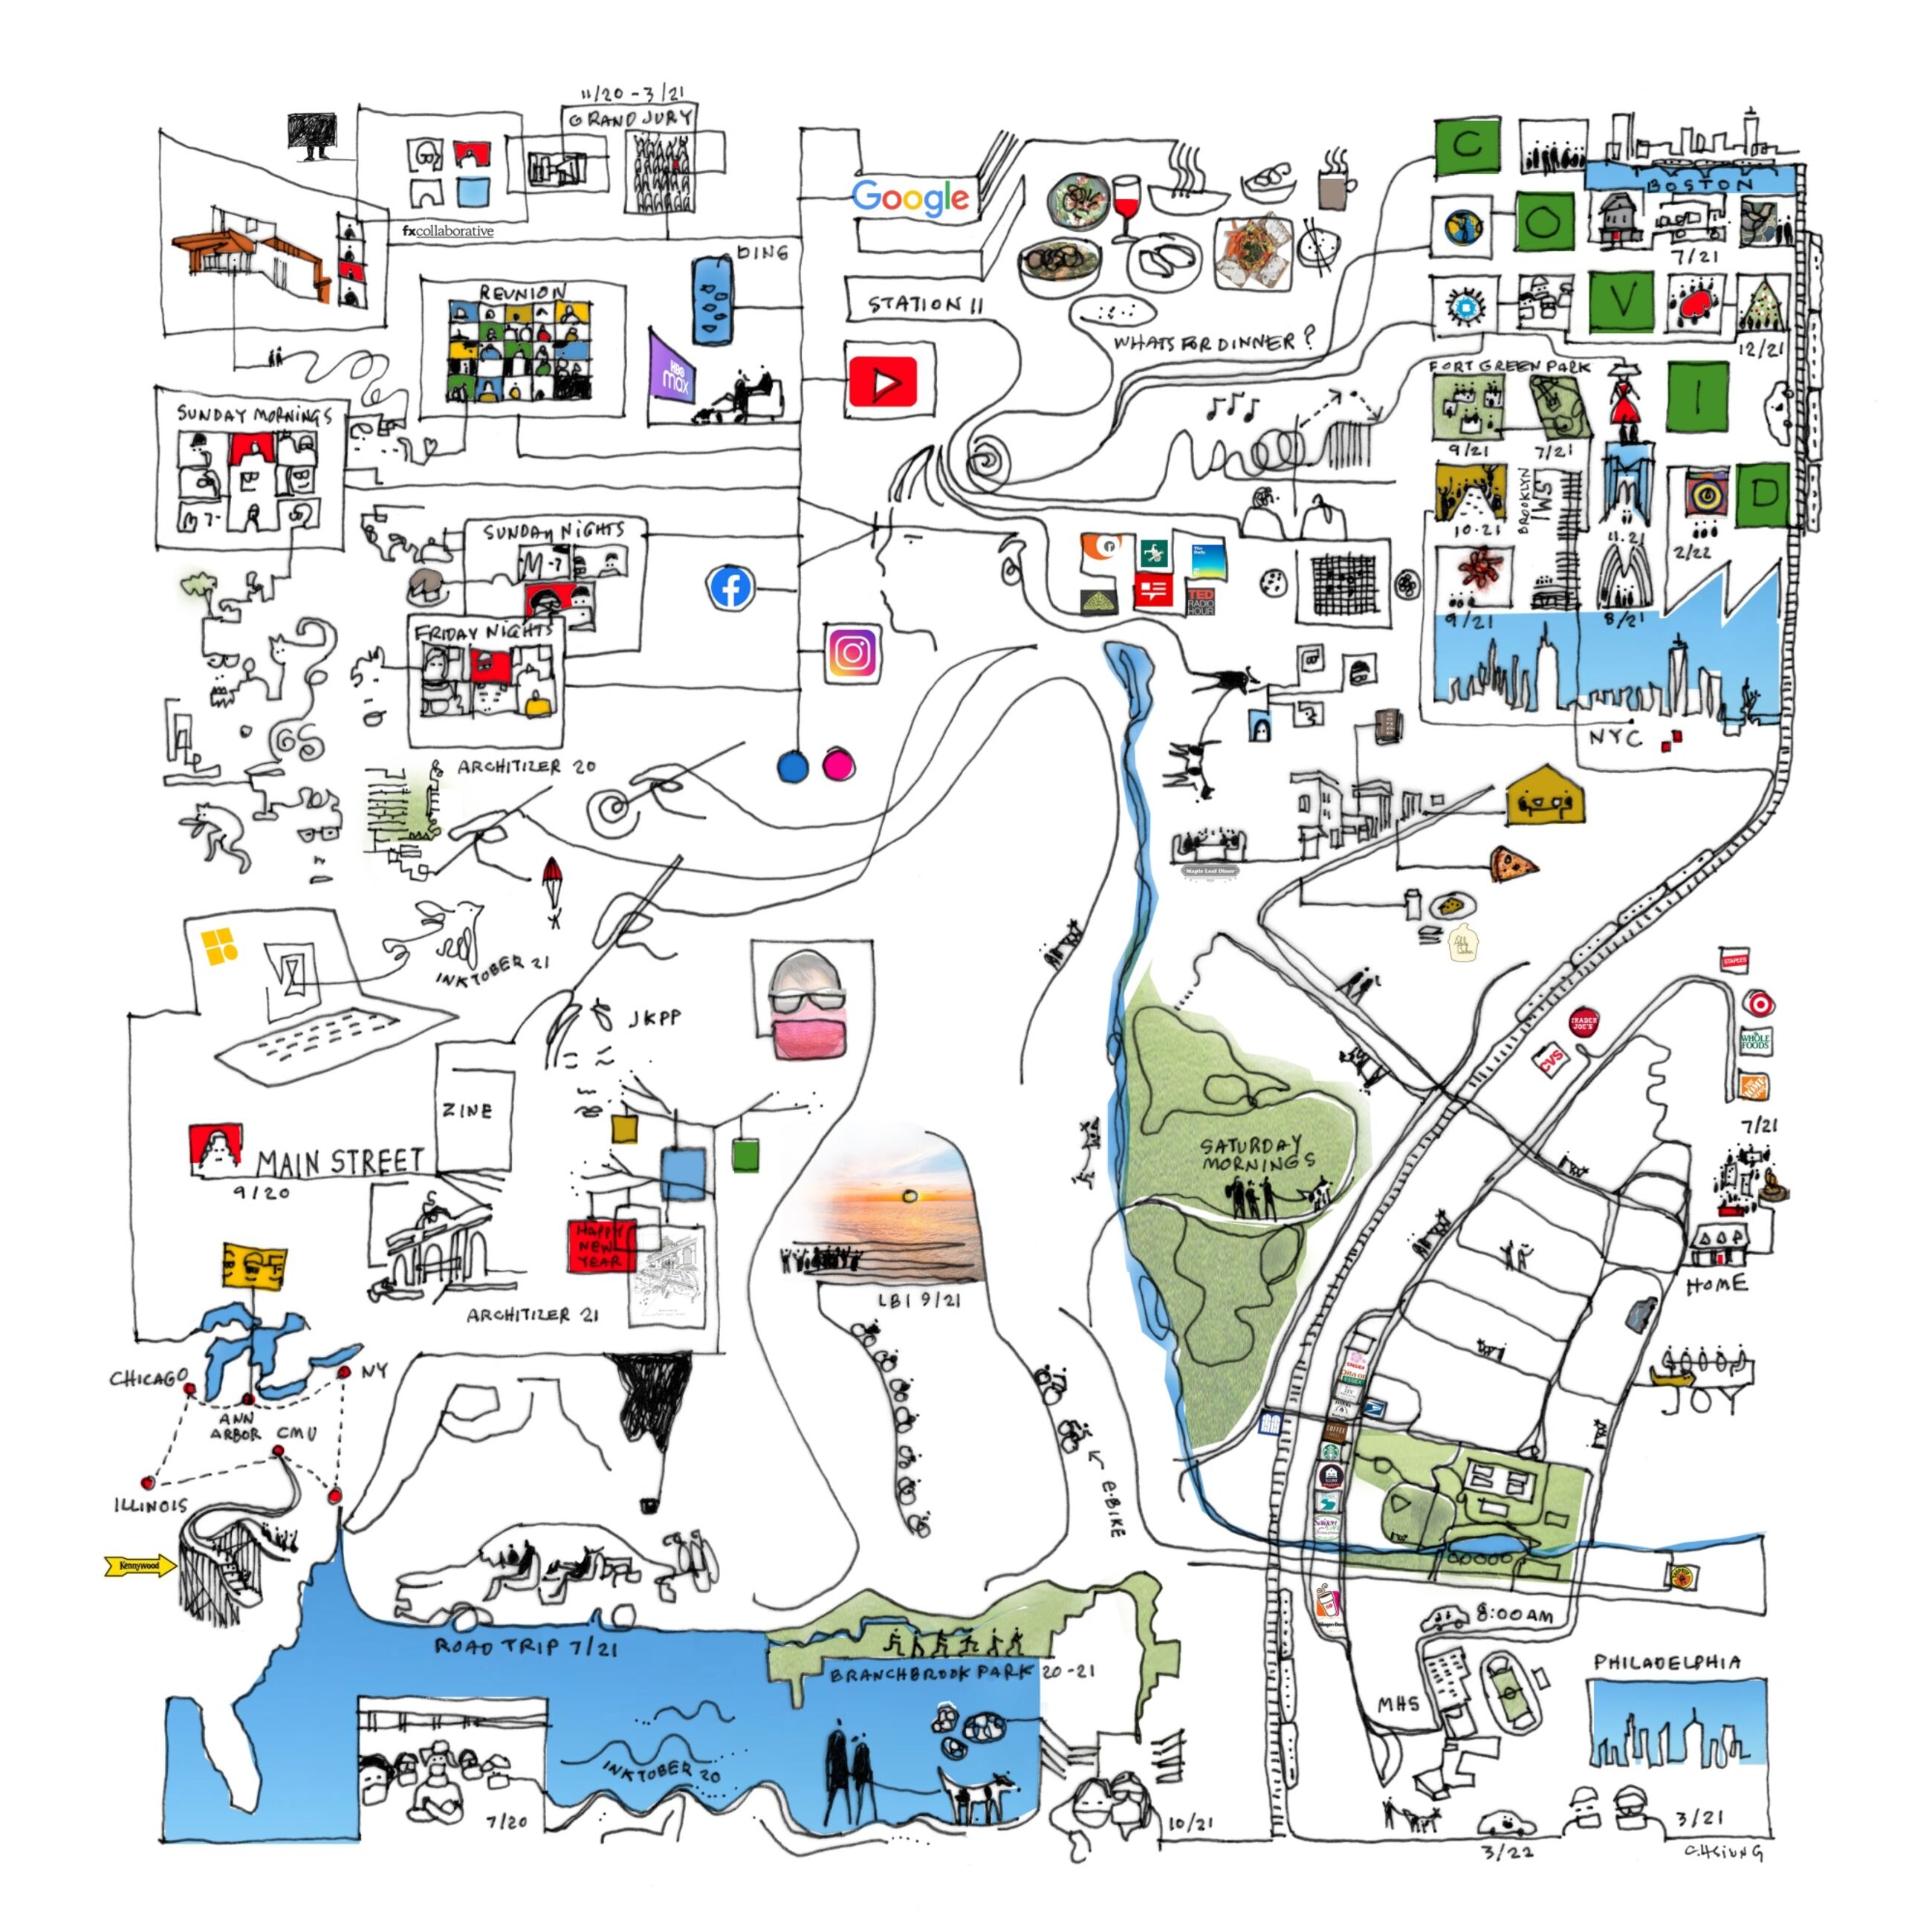
Two years ago, at the beginning of the current pandemic, Bloomberg CityLab asked readers to map their life under quarantine. They displayed many maps, some of which were featured here on a previous blog post. Last week they published over 65 of these maps as The Quarantine Atlas.

While the publisher's page does not show any examples, there are quite a few on this Bloomberg page as well as many other maps not in the atlas. Here are a few that I like.

Tiara Lui - Hong Kong

Nice job showing the commute and pandemic disruptions to the city.

Nabilla Nur Anisah - Depok, West Java, Indonesia 

Many of the maps show floor plans of the residence as that is where people are stuck. I like this one because it contrasts the home life with the three hours of commuting to an office in South Tangerang.

Alfonso Pezzi - London transformed. Everything is delivered home including entertainment and work.

Finally here is one that did not make the atlas but I like all the intersecting geographies; floor plans, the local park, the drive to school, various road trips to nearby cities and then out to Illinois.

Carol Hsuing - Millburn, New Jersey


Wednesday, April 20, 2022

Mapping the Indigenous Diaspora

The Comunidades Indigenas en Liderazgo (CIELO), a non-profit advocacy organization, in conjunction with UCLA created a story map called We Are Here, showing the indigenous diaspora of Los Angeles. This is to counter the "statistical genocide" the US Census creates by lumping these groups under the broad Hispanic/Latino classification. This erases their cultural differences, including 30 different unique groups speaking over 17 indigenous languages. The map shows the locations of these language speakers by color.

Clicking on a zip code brings up a pie chart of the language speakers.

Unfortunately the colors of the pie chart are not the same as those of the map leading to confusion. On this graph the K'iche speakers are yellow but on the map they are green. On this chart they are blue.

The tabulation by zip code also creates confusing dot effects on the map where the shapes of more dense zip codes are emphasized. This graph within the story map shows the universe of languages on the maps.

The organization aims to get the public agencies of the City and County to recognize and provide translation services for these languages. Here is a translation card for the Guatemalan regional dialects - there is a separate card for Mexican regions.

As you scroll through the story map you get videos and map content showing the locations of festivals, conferences and organizations that aim to teach the cultural traditions.

The story map is on view at the Mixpantli: Contemporary Echoes exhibit of Los Angeles County Art Museum (LACMA)

Wednesday, April 13, 2022

Maury's Wind & Current Charts

U.S. Naval Officer Matthew Fontaine Maury developed wind and current charts starting in the 1840's. They helped save shipping companies millions of dollars and avoid losses of life and cargo by giving sailors critical information about wind and current patterns. 

Wind & Current Chart of the North Atlantic-via American Geographical Society Library

Detail off the coast of Tampico, Mexico
As director of charts for the Navy, Maury had access to decades of ships' logs. These logs included routes and weather conditions. During the California gold rush these charts helped shorten the trip from New York to San Francisco by 40 days or more. 

The length of the arrows denotes the strength of the current. Colors indicate the season of each track. The dots represent wind speed as indicated in the legend below.

Here is a detail of the mouth of the Rio De La Plata from one of his South Atlantic charts.
via Yale University Library

Maury went on to map the Pacific and Indian Oceans, monsoon patterns, ranges of the sperm whale and discovered an undersea plateau that could be used for laying the first transatlantic cable. More on his life can be seen in this PBS American Experience article.

Wednesday, April 6, 2022

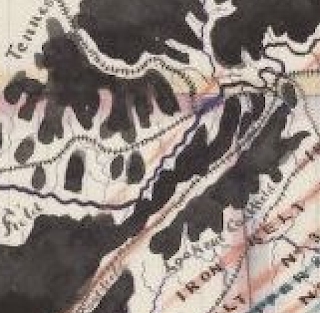
Alabama Coal & Iron Sketch

I found this charming map looking through the University of Alabama's impressive online map collection.

William Atkinson, 1872

I love the way the coal looks like spilled ink. Let's appreciate it up close.

There are lots of charming hand drawn details such as the railroad tracks and city symbols. One of the most charming things about this map is its inaccuracy. The coast of Florida dips south way too soon, as does Mississippi. Nashville is too far south. Even parts of Alabama are off. The coastal part is too wide and a bit off too. The border with Florida is too straight and the whole state seems a bit short. In an age of digital maps using common databases, this stuff is refreshing.


Wednesday, March 30, 2022

Women's Suffrage in 1917

As a follow up to Women's Suffrage in 1908, here is an ad from 1917 showing how suffrage (the white areas*) had expanded through most of Canada and parts of the United States. 

The ad is from the National Women's Suffrage Publishing Company and asks how long the U.S. will lag behind Canada. For contrast here is the 1908 map again. Keep in mind that the color scheme is reversed.


*yes the white areas are actually sepia areas, OK.