
Those of us in the USA will be seeing many election maps over the next few days. In the interest of not being every other site, here are some maps of other important elections that have happened this year in large countries that we (myself included) pay much less attention to than we should.
Brazil
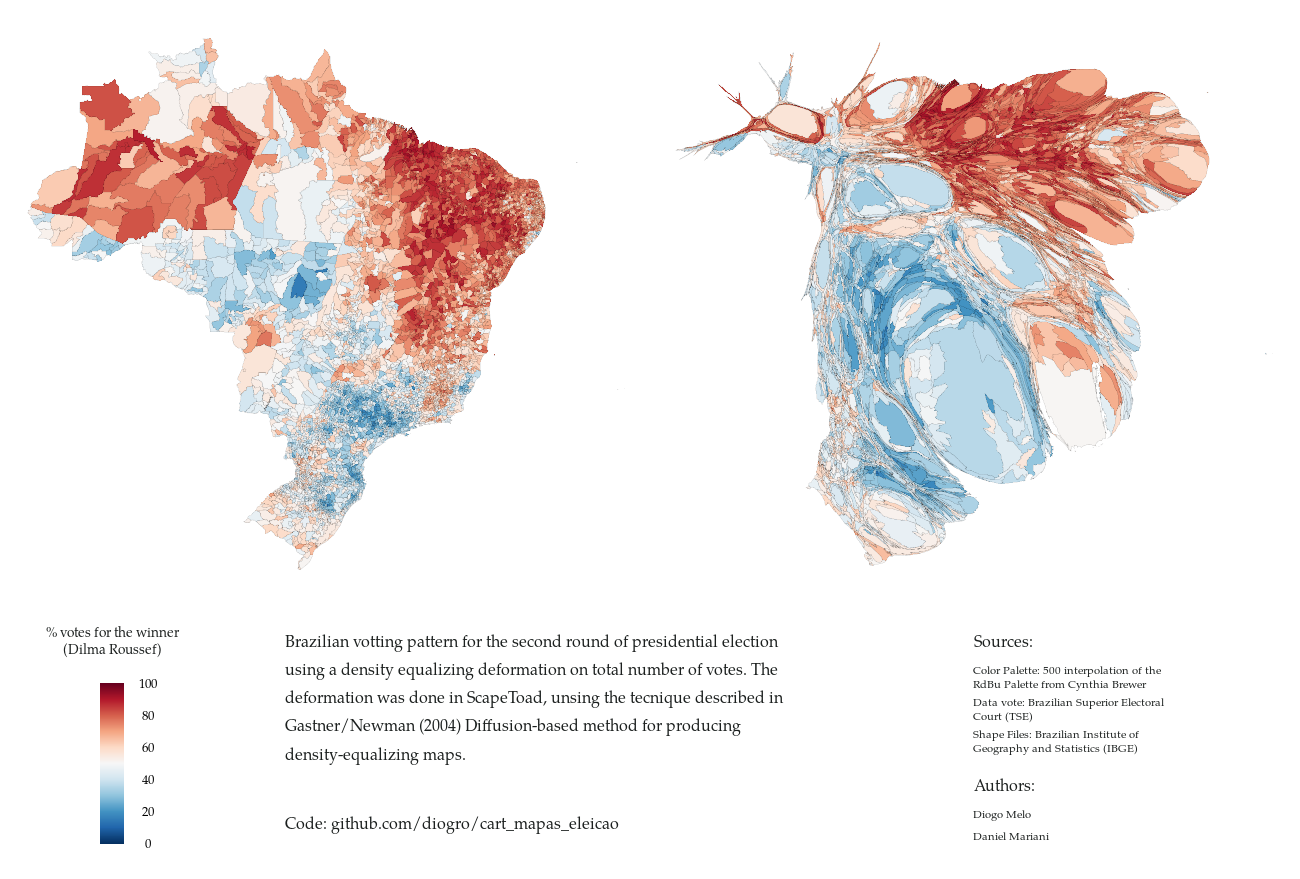
In last month's election, incumbent president Dilma Rousseff won both rounds. The map above shows her vote in the runoff election in red and challenger Aecio Neves in blue. On the right is a cartogram - areas proportional to population. Usually cartograms do a better job of showing results but in this case it's actually more difficult to see that she won than the conventional map. I suspect it's due to the strength of support Rousseff saw in the areas she won.
This map uses a gray neutral color instead of the purple we often see in our red-blue maps. This makes for a clearer distinction of areas. Author Diogro Melo does a nice job listing his sources, even for the colors. He also has a link to the code used to create the cartogram.
India

India had a major parliamentary election in the spring and the BJP with it's allies (the National Democratic Alliance) won a major victory over the Congress party and their allies. A huge number of parties in India would normally make for a colorful map, but in this case it is mostly BJP orange. Congress allies are shown in shades of blue. A cartogram would have shown much more blue with many of the small blue areas being large cities - more colorful, yet uglier as cartograms tend to be.
Indonesia
The world's fourth most populous country had its third presidential election. Twelve parties formed two coalitions with Joko Widodo's coalition winning.
 The red/crimson (what?) color scheme used on Wikipedia is unconventional and barley works. Widodo's winning coalition is red, Subianto and Harvard University are crimson. The geographic pattern is basically Sumatra vs. elsewhere. This map would probably be more interesting with more parties, instead of just the two coalitions. Like, for example, the 2009 Election

Afghanistan
Less populous but also important is Afghanistan. Their election suffered from violence, accusations of fraud and a lack of good maps. Here is the best map I could find.

Votes for Ashraf Ghani, the declared winner are shown as green proportional circles. Votes for Abdullah Abdullah (the candidate so nice they named him twice) are in purple. The trouble is in making out a pattern underneath the noise of the heavy colors representing ethnicity. A simple dulling of the ethnic colors and/or brightening the circles would help see the relationship between these patterns. Even better would have been to choose colors for the circles that are clearly different from the ethnic colors.
 Egypt also had a presidential election. I have not been able to find maps, probably because el-Sisi won 97% of the vote*. I suppose the map would look like this.
* 97%? A bit above the credibility threshold?
Brazil

In last month's election, incumbent president Dilma Rousseff won both rounds. The map above shows her vote in the runoff election in red and challenger Aecio Neves in blue. On the right is a cartogram - areas proportional to population. Usually cartograms do a better job of showing results but in this case it's actually more difficult to see that she won than the conventional map. I suspect it's due to the strength of support Rousseff saw in the areas she won.
This map uses a gray neutral color instead of the purple we often see in our red-blue maps. This makes for a clearer distinction of areas. Author Diogro Melo does a nice job listing his sources, even for the colors. He also has a link to the code used to create the cartogram.
India

India had a major parliamentary election in the spring and the BJP with it's allies (the National Democratic Alliance) won a major victory over the Congress party and their allies. A huge number of parties in India would normally make for a colorful map, but in this case it is mostly BJP orange. Congress allies are shown in shades of blue. A cartogram would have shown much more blue with many of the small blue areas being large cities - more colorful, yet uglier as cartograms tend to be.
Indonesia
The world's fourth most populous country had its third presidential election. Twelve parties formed two coalitions with Joko Widodo's coalition winning.


Afghanistan
Less populous but also important is Afghanistan. Their election suffered from violence, accusations of fraud and a lack of good maps. Here is the best map I could find.

Votes for Ashraf Ghani, the declared winner are shown as green proportional circles. Votes for Abdullah Abdullah (the candidate so nice they named him twice) are in purple. The trouble is in making out a pattern underneath the noise of the heavy colors representing ethnicity. A simple dulling of the ethnic colors and/or brightening the circles would help see the relationship between these patterns. Even better would have been to choose colors for the circles that are clearly different from the ethnic colors.
Egypt also had a presidential election. I have not been able to find maps, probably because el-Sisi won 97% of the vote*. I suppose the map would look like this. * 97%? A bit above the credibility threshold?


No comments:
Post a Comment