
Those of you who follow me on my Twitter and Mastodon feeds know that I spent February doing yet another map challenge. Like November’s 30 Day Map Challenge, only this one encourages you to fail. The #mapfail hashtag is popular and somewhat contentious among cartographers. Today’s software allows any untrained person to make a map and some of them are quite bad, though some of the #mapfail’s that get called out are a bit unnecessarily snobbish. Anyway, here are the daily mapfail prompts and the official challenge page is here.
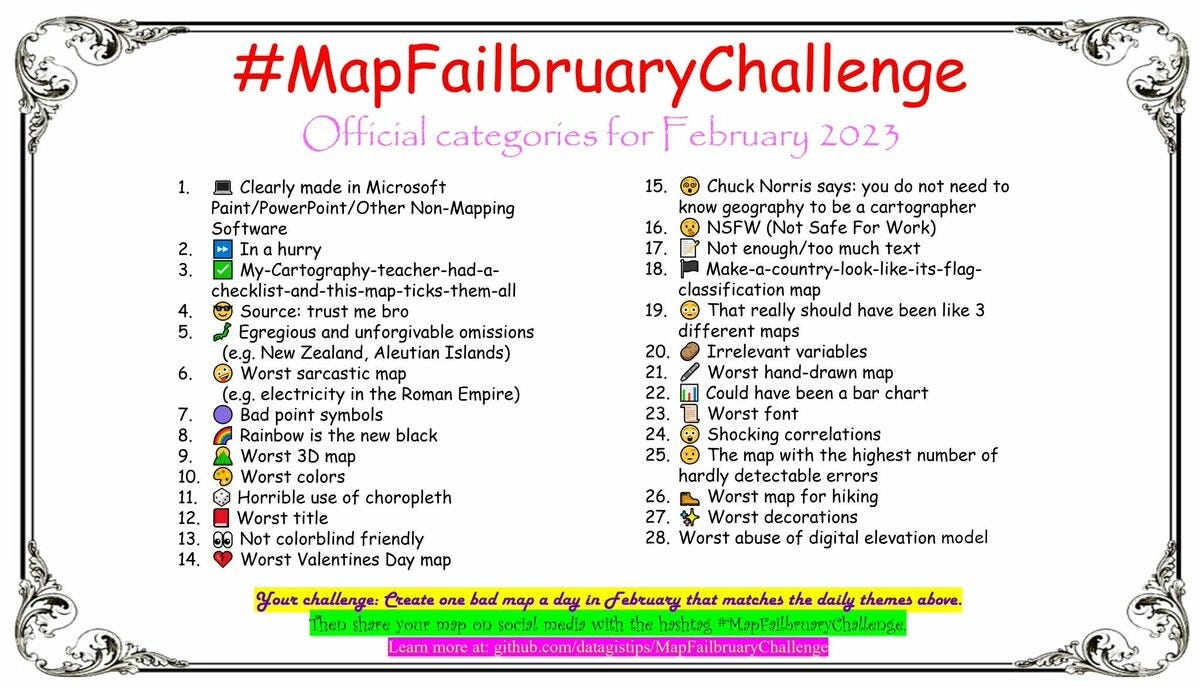
Failing can be harder than it looks but this has been a lot of fun. I will post my entries with minimal commentary-a few maps will need some explaining though.
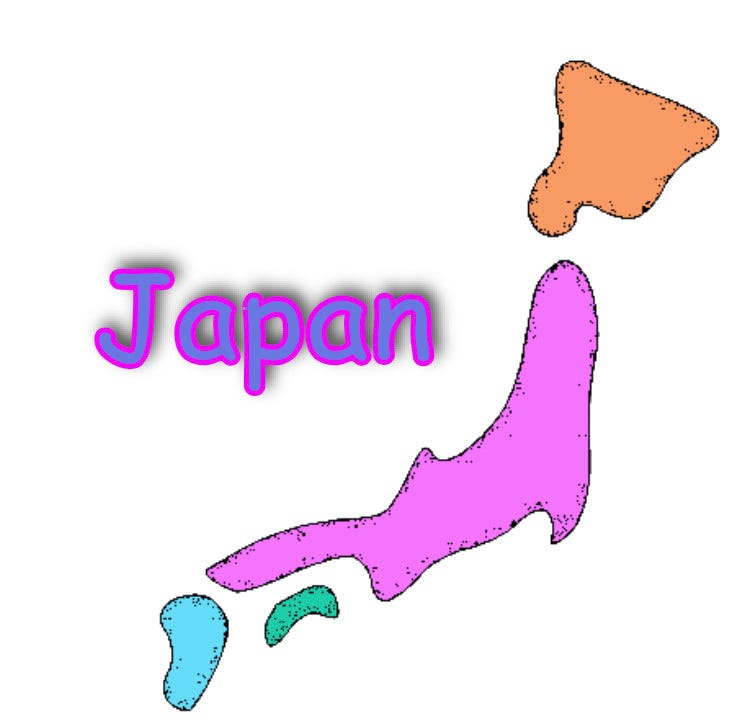
Day 1 - clearly made in non-mapping software
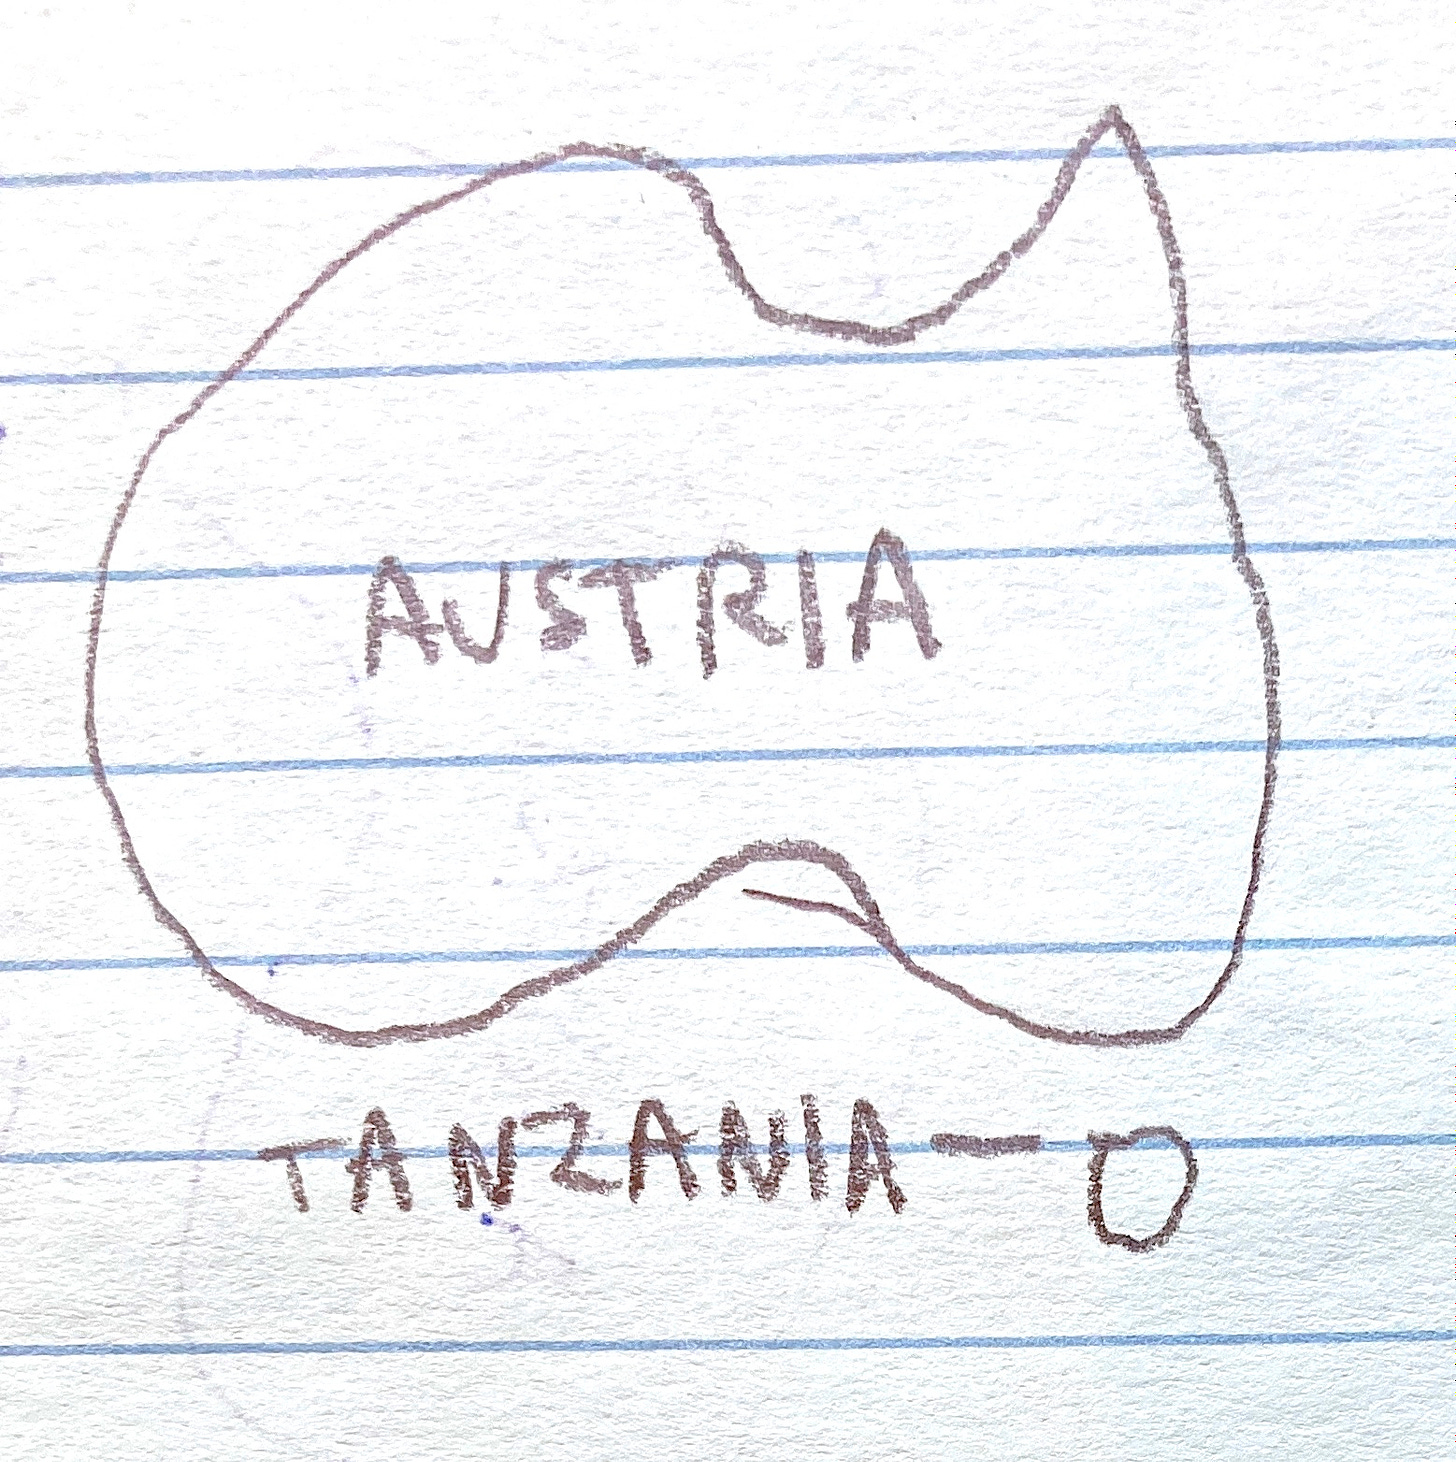
Day 2 - in a hurry
Day 3 - my cartography teacher had a checklist and this one checks them all

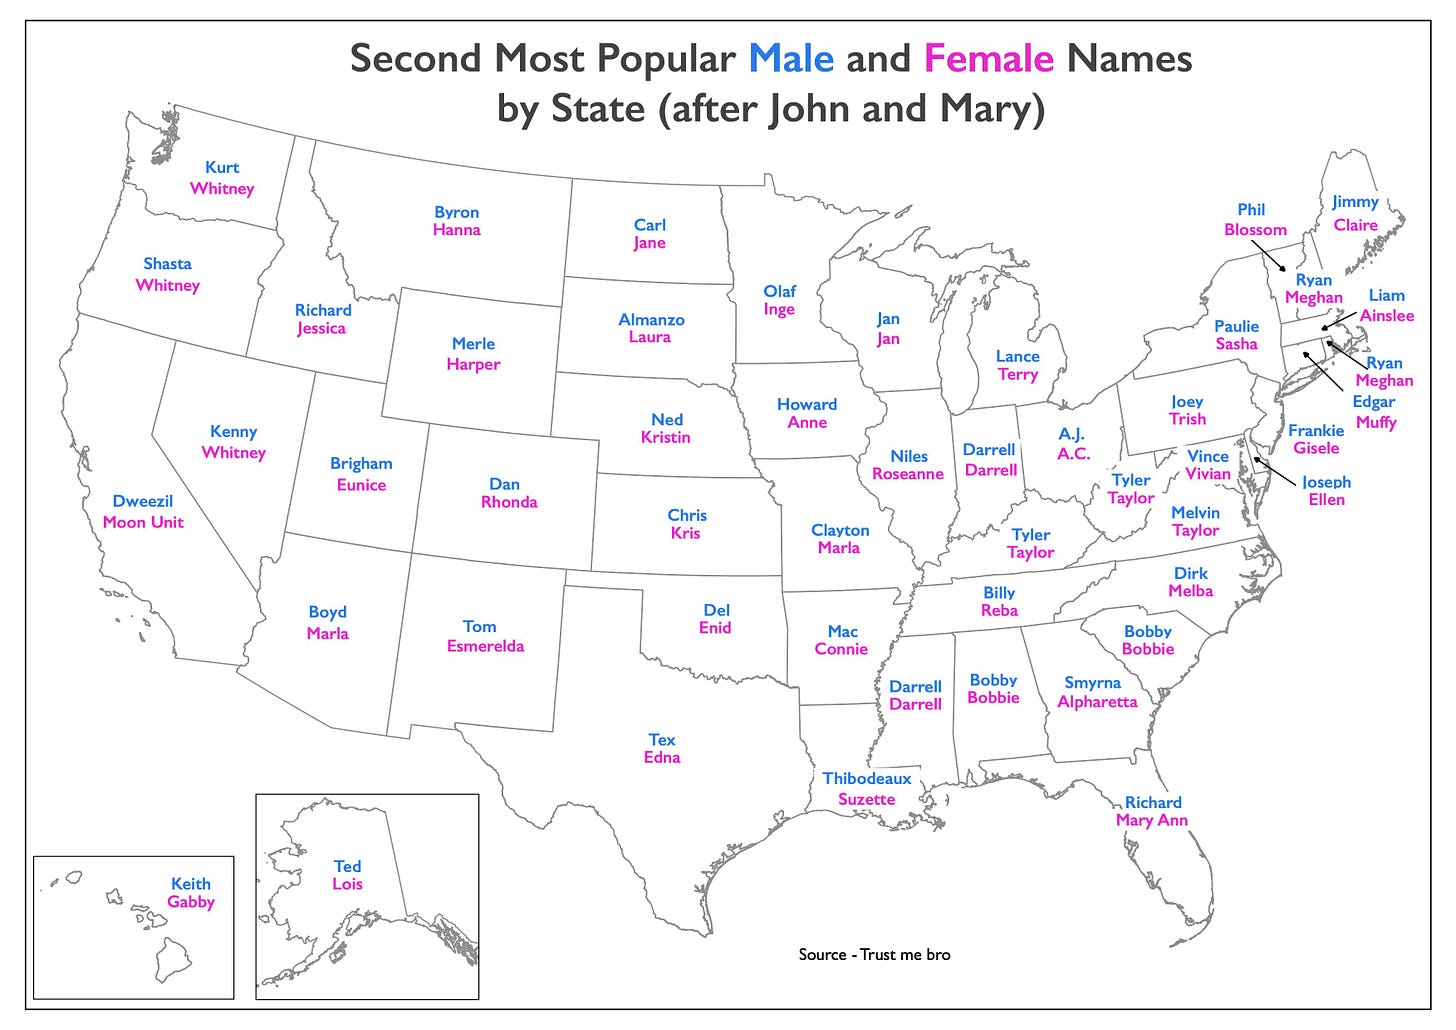
Day 4 - source: “trust me bro”. I used this source several more times. I made this data up quickly without a lot of thought.
Day 5 - egregious and unforgivable omissions.

I have nothing against France, in fact I’m quite fond of the place but I did want to see what the world would look like without it.
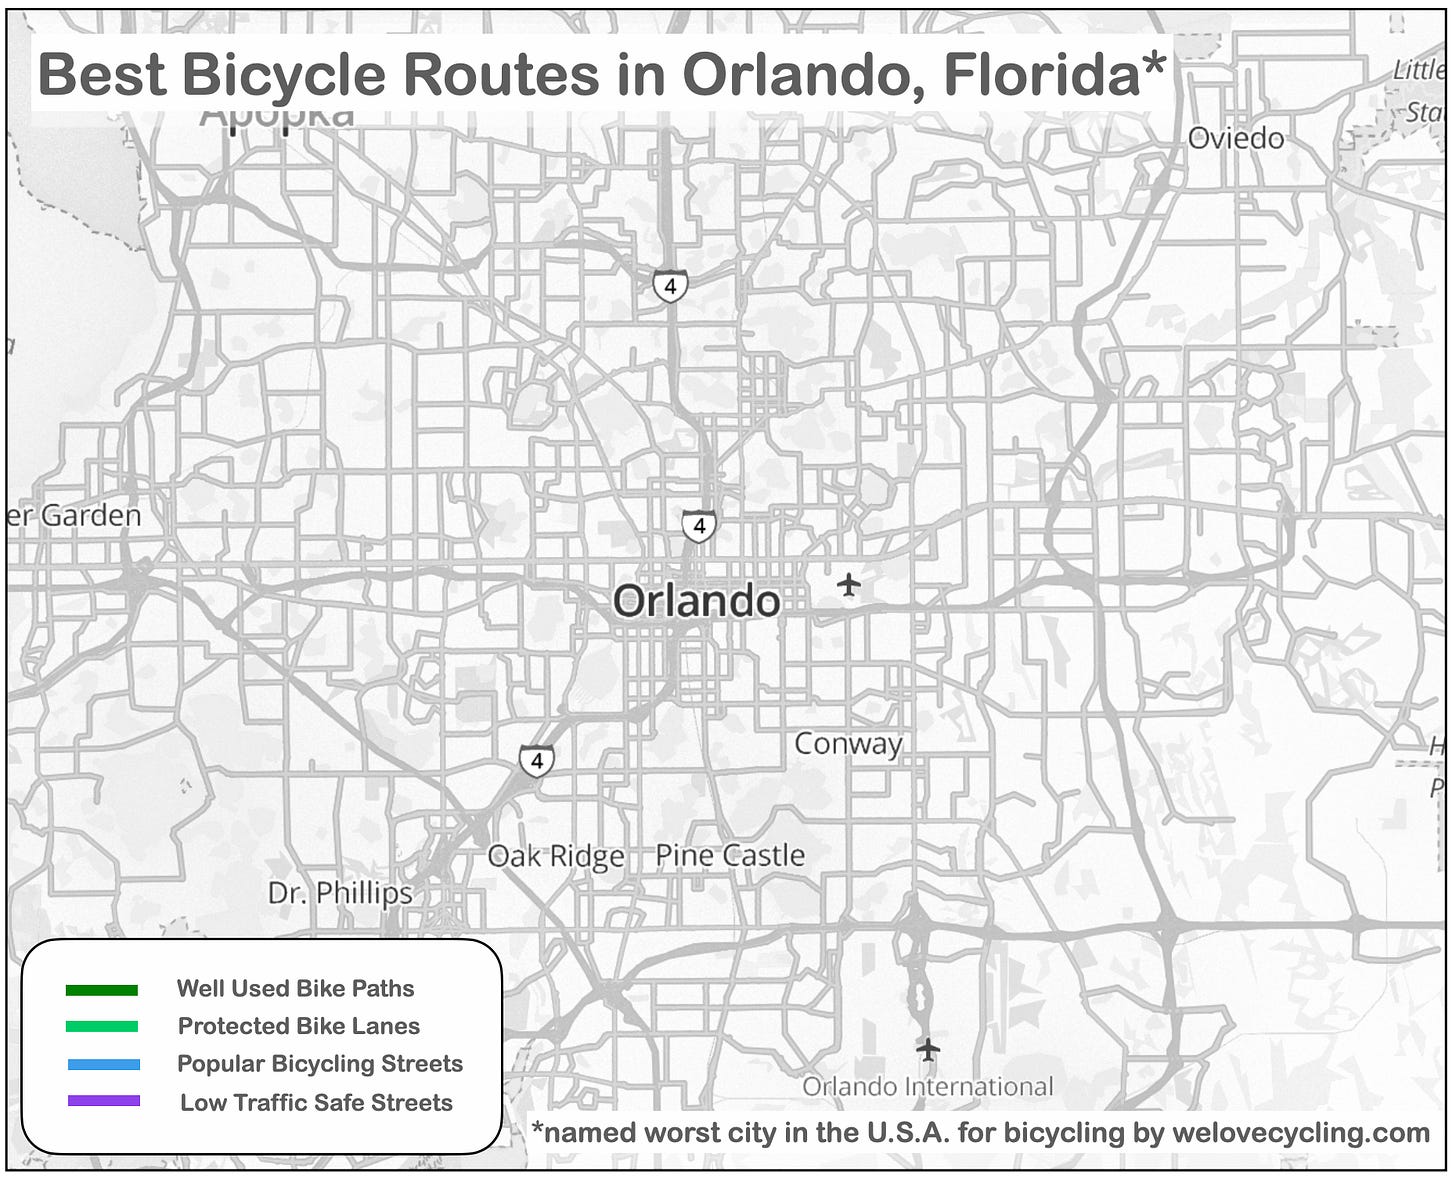
Day 6 - worst sarcastic map
Day 7 - bad point symbols

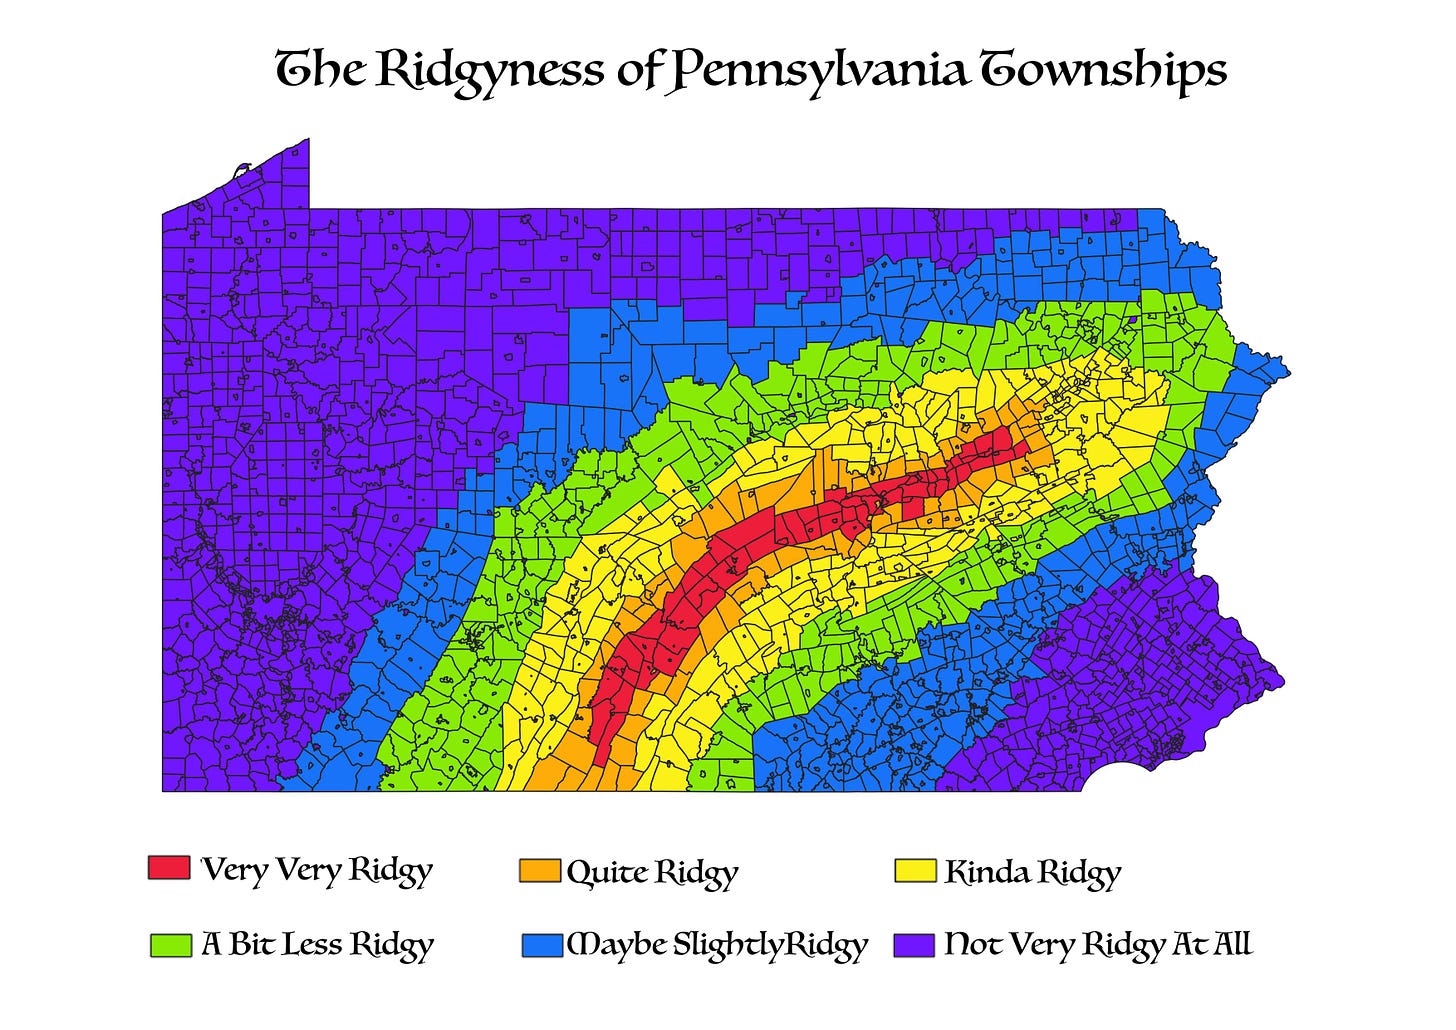
Day 8 - rainbow is the new black. Rainbow color schemes are appealing but they do a terrible job conveying values along a color scale (ie. what is darker, lighter). There is a use for them though, they’re fine for weather maps. Pennsylvania is known for its “ridge and valley” topography. I made up a fake term “ridgyness” to show it. It would have been more rainbow like if I had extended the red all the way across the state though.
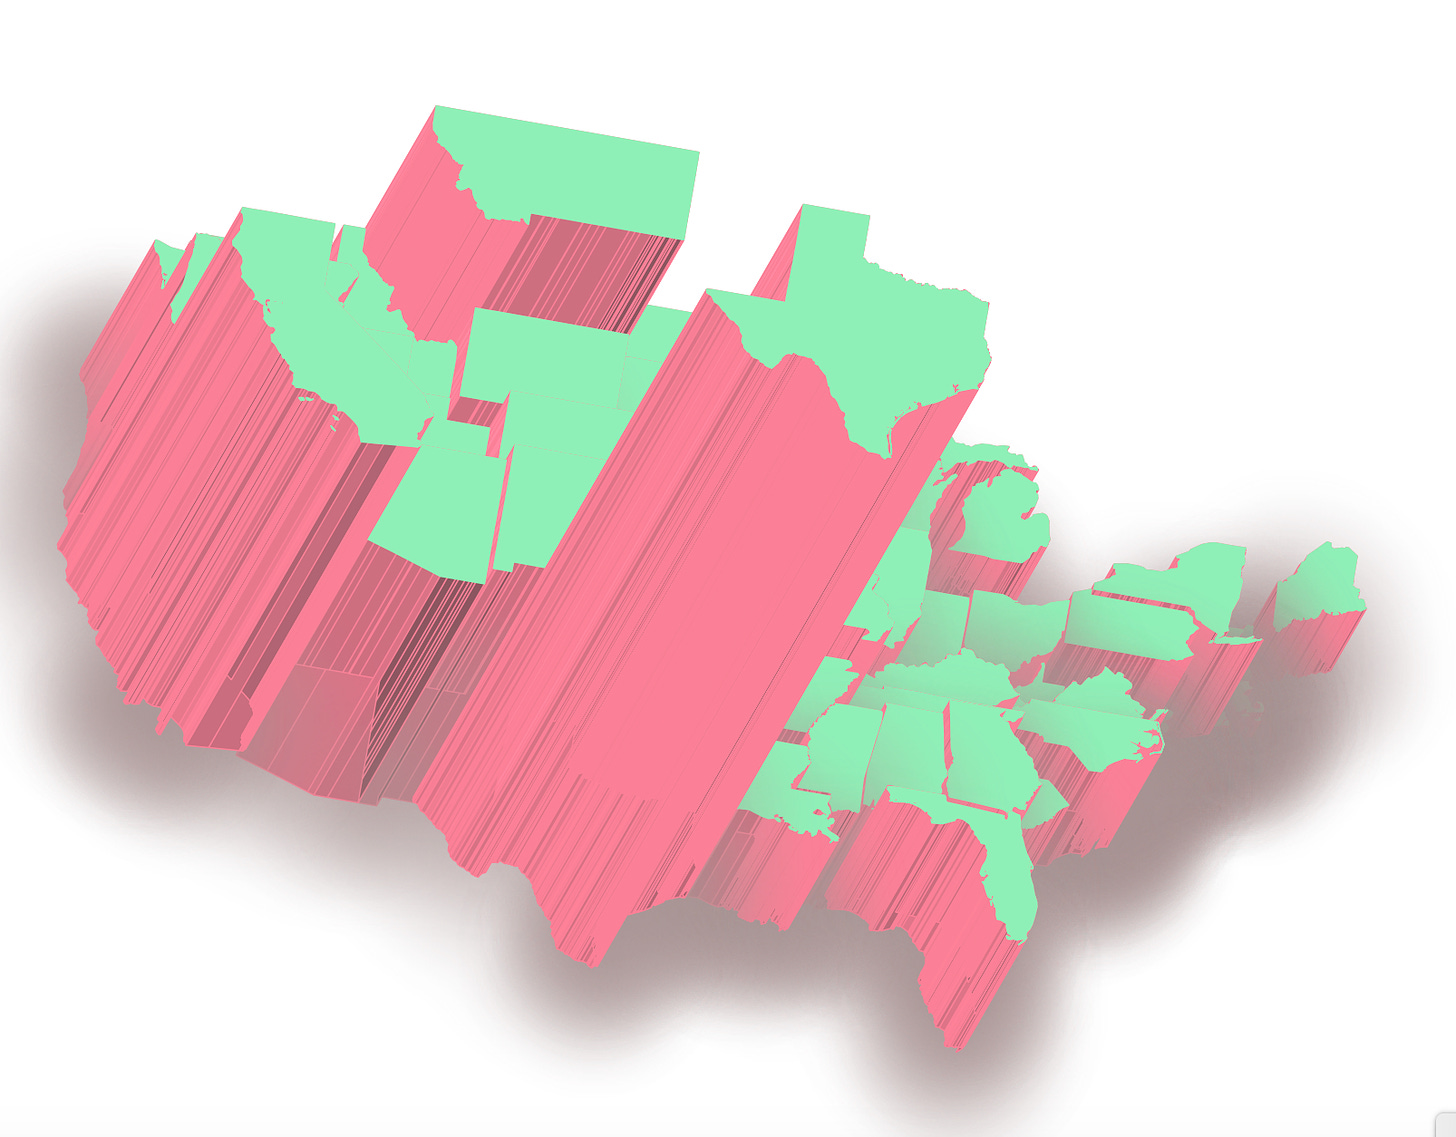
Day 9 - worst 3D map
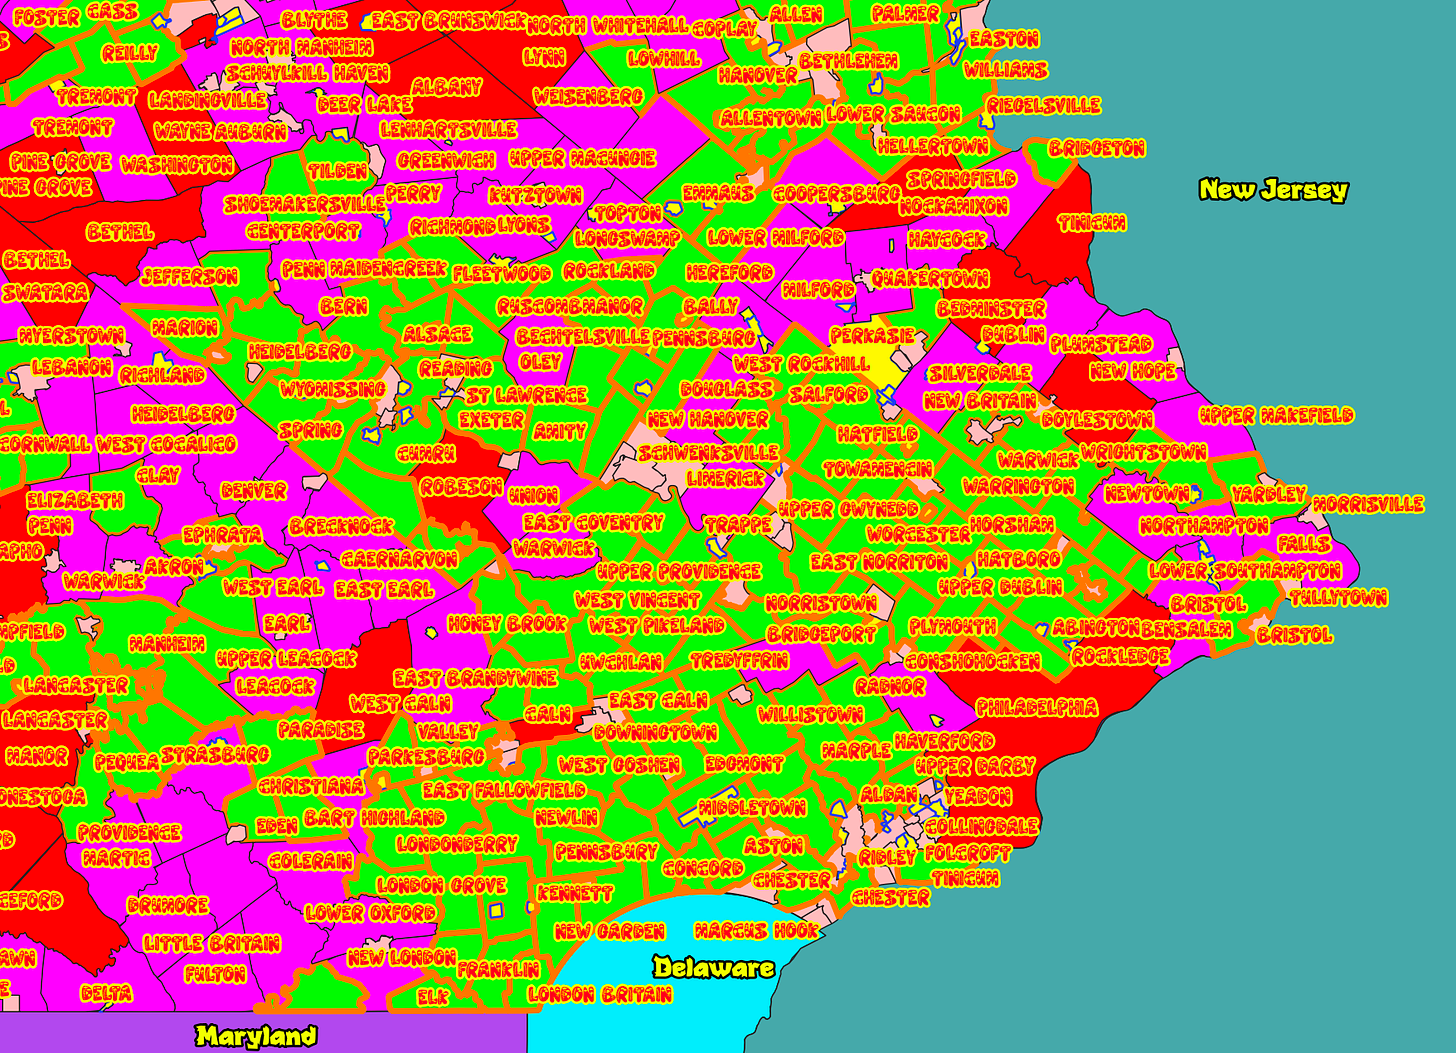
Day 10 - worst colors. I saved a little time by using the same data from Day 8,.
Day 11 - horrible use of choropleth. Choropleth refers to maps showing areas (or points) shaded or colored by some value (ie population density, voting results, etc). A couple people pointed out to me that in South Korea babies are considered to be 1 at birth so the map is wrong!

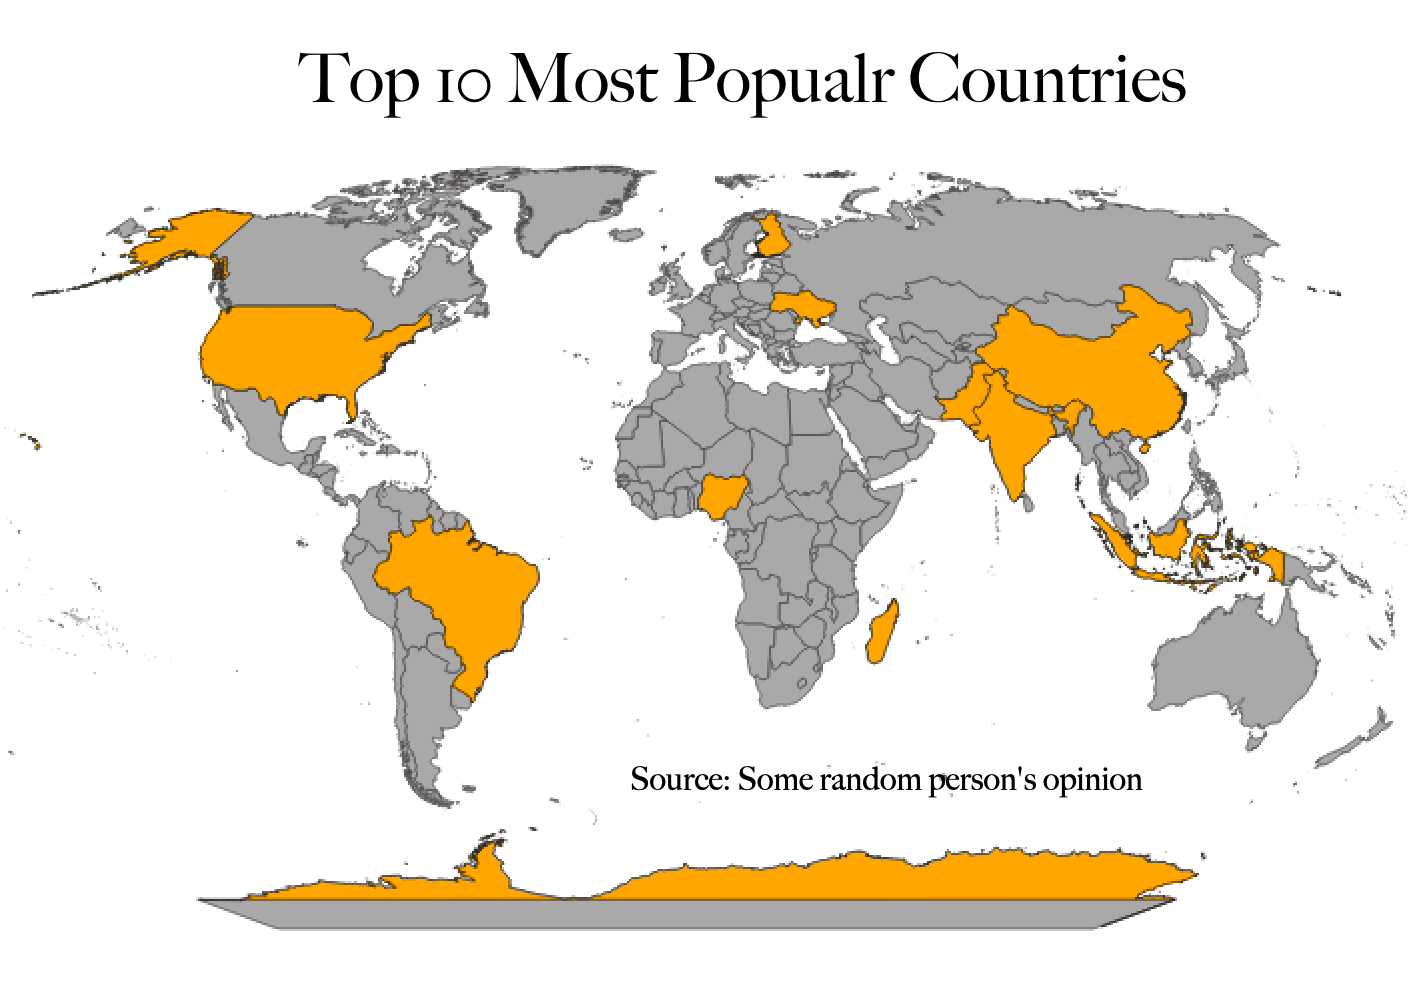
Day 12 - worst title. Based on a map of the most “populous” countries. Popular is a meaninglessly subjective title. Also there’s a typo in the title that I left for effect.
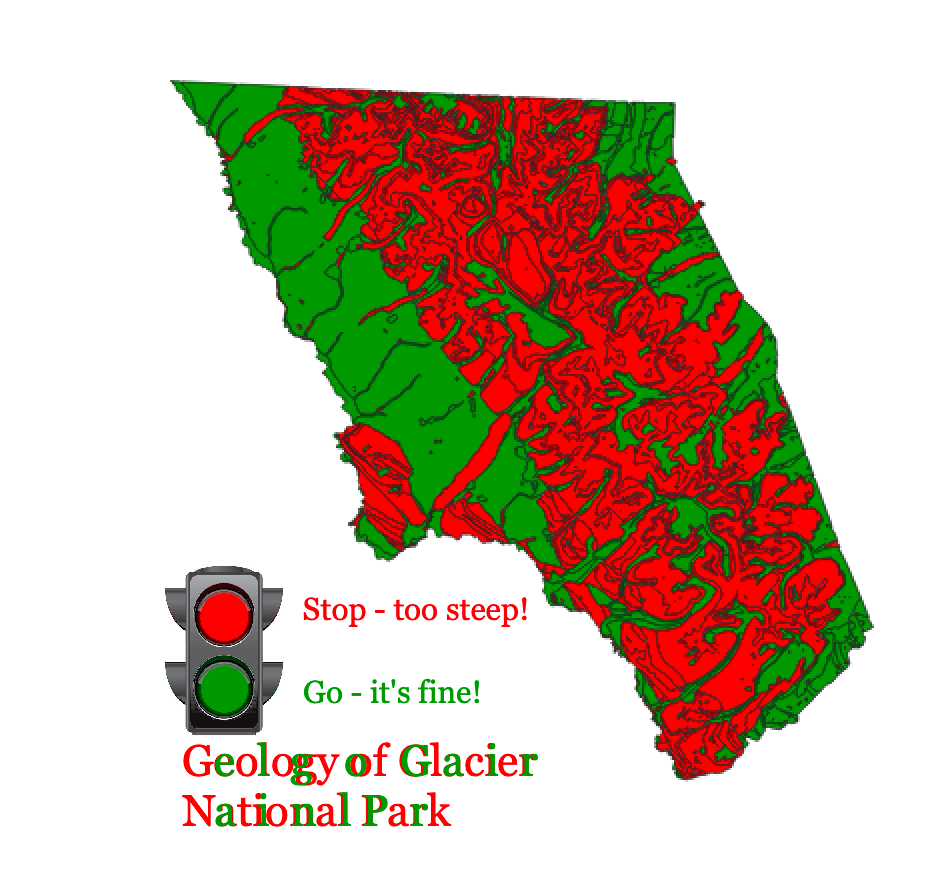
Day 13 - not colorblind friendly. The most common form (and it’s common!) of color deficiency is difficulty in distinguishing red from green.
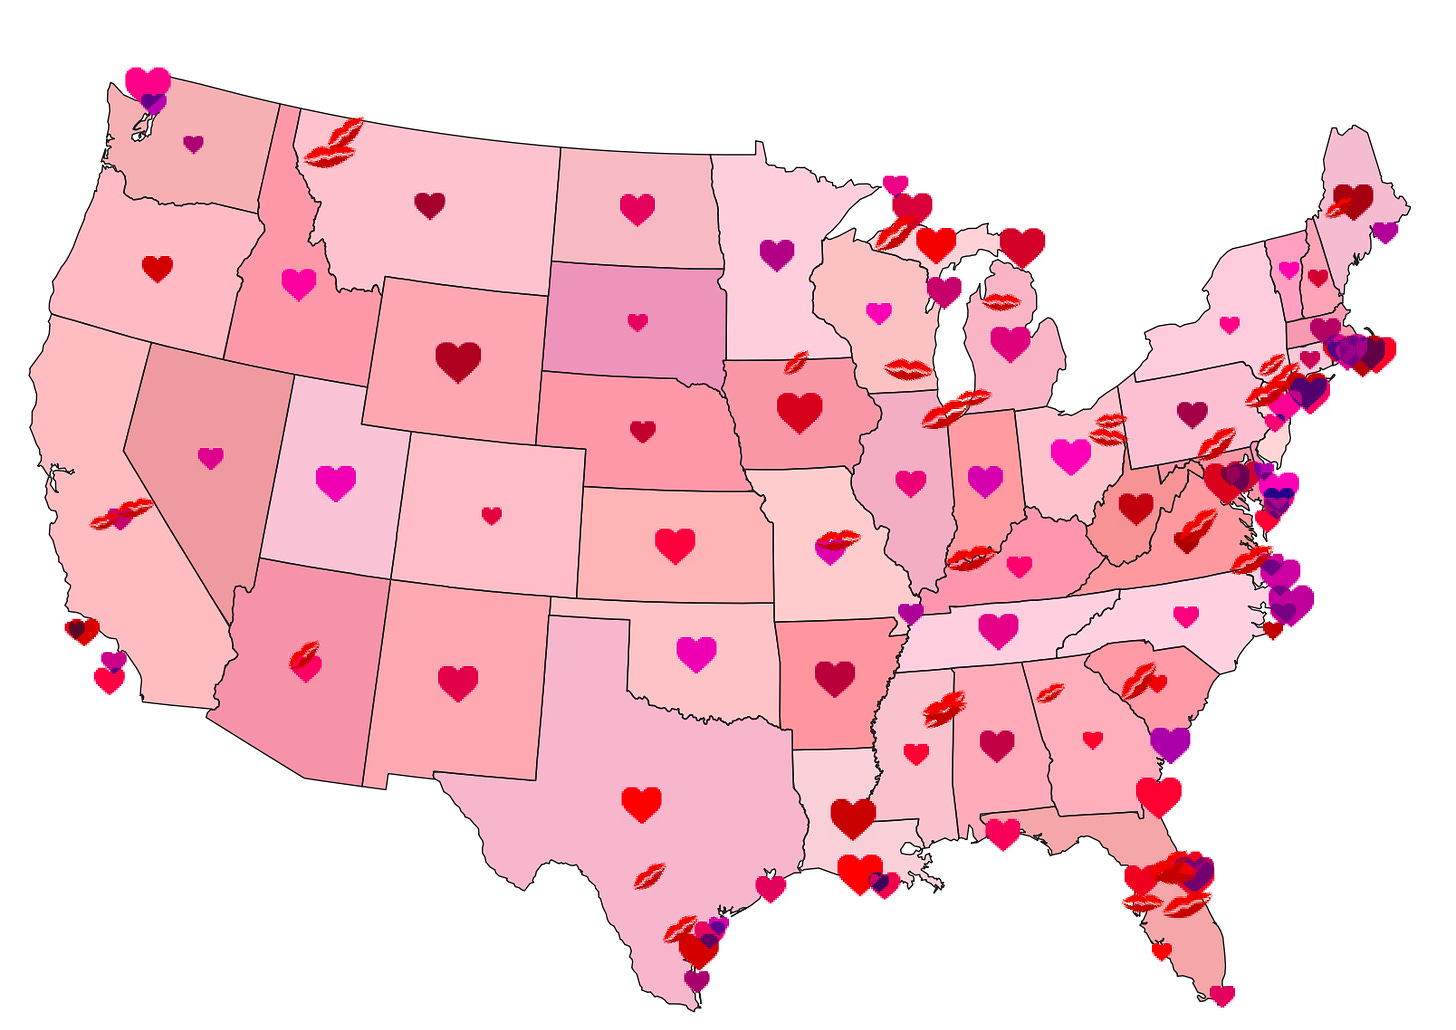
Day 14 - worst Valentine’s Day Map.


No comments:
Post a Comment