I was recently in Harvard University's Graduate School of Design (GSD) when I came across this fantastic exhibit on the Grand Paris Express. The GPE is a hugely ambitious project to add several metro ring lines connecting the suburbs of Paris to each other and to the central city. It will be 90% underground and consist of 200 km of new rail lines and 68 new stations.
 |
| Map via STM |
Construction began in 2016 and is planned to be completed by 2030. The new lines are shown in white on this image from the exhibit.
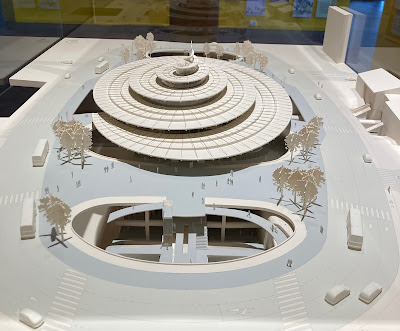
The project won the GSD's Veronica Rudge Green Prize in Urban Design. "The overarching goal of GPE is to challenge the current monocentric model of Paris and create an open-ended megalopolis by radically changing existing patterns of circulation and decentering Paris itself." The project's ambitions go well beyond simply building 68 new stations. There has also been a huge effort to design these stations to be artistic, consider the flow and mood of spaces as you move from the street down towards the train platforms and to reflect the localities of each station. Here is a 3D model of the Noisy-Champs station.
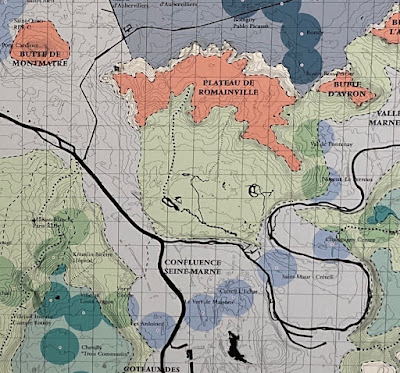
Here is part of a "landscape strategy" map showing the types of terrain the new stations will be located underneath.This map of "Sensoriality" is difficult to understand.
Even after figuring out the French, the legend is still almost impossible decipher,
and even more difficult to pick up from the map detail.
This map shows how the lines will serve the lower income (lighter colored) areas,
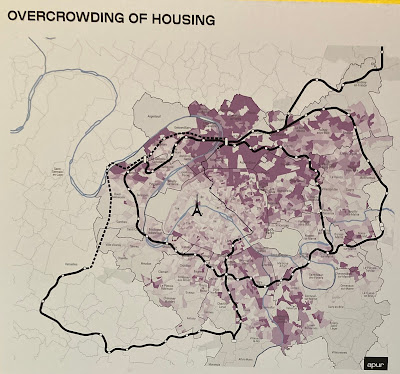
and another one shows areas where housing is overcrowded.
The increase in access to jobs is shown here. I left off the legend for formatting purposes but the darkest circles will have a more than 150% increase in access by 2030.
Here is one showing "urban momentum" highlighting housing construction projects that the project has spawned. The blue buildings are the larger projects.
Finally from the exhibit, a maps showing new areas (darker lines) that will be walking distance to a metro station.
The graph in the lower right corner is a bit hard to decipher from my poor photography but it tells an interesting story of transportation. Basically, pink is walking, yellow is various forms of transit starting with the horse and green are cars. The time period runs from about 1810 to 1930 and you can see the rapid rise and predicted decline in car use in favor of transit, bicycling and various other forms of mobility.
One major issue, only briefly addressed by this exhibit is that Paris will be hosting the Olympics next summer. I think the plan is to have the parts of lines 15, 16 and 17 that serve the stadium and Olympic Village finished in time. Here's a map of Line 16 from the GPE web page.Unfortunately this exhibit ends March 31st so if you want to see it live hurry up. Hopefully they keep the online exhibit up for a while.


No comments:
Post a Comment